
Otel LGTM Observability - python(FastApi) automatic instrumentalization metrics
Automatic observability stack for FastAPI with OpenTelemetry: instead of exposing /metrics, all traces, metrics, and logs are collected automatically through OTEL and sent to Grafana LGTM (Loki, Grafana, Tempo, Prometheus), with optional S3 persistence and an optimized Docker setup.
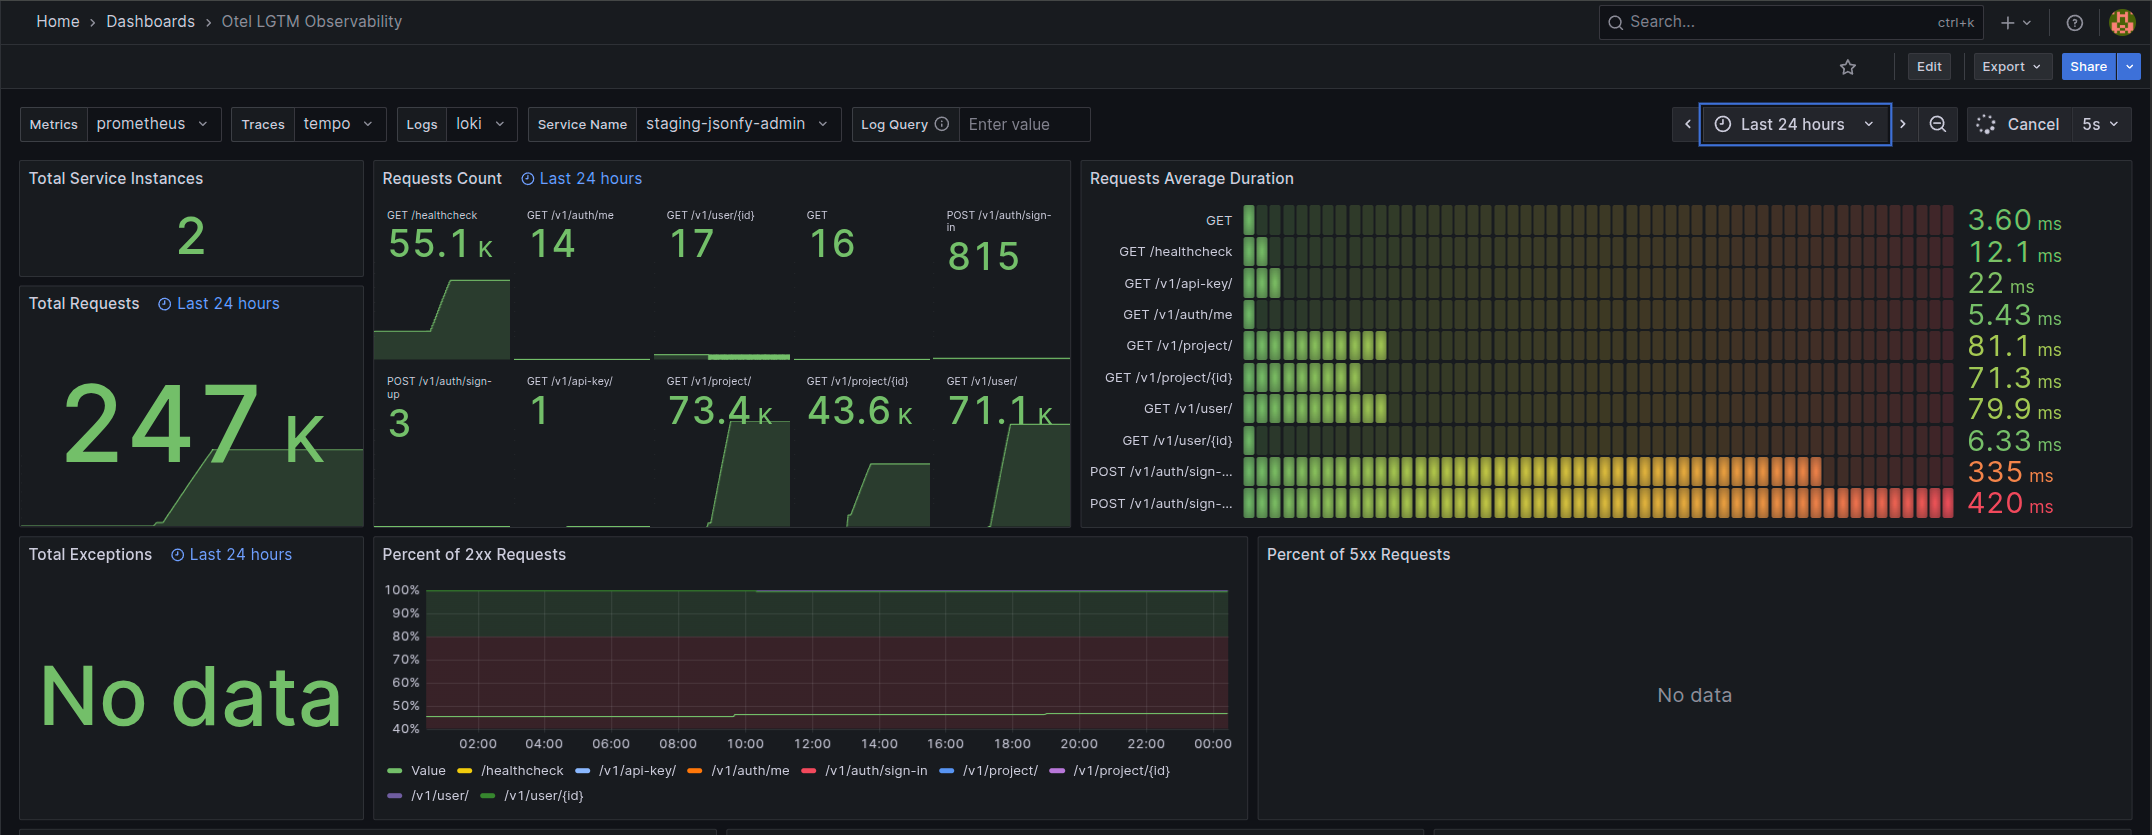
faca um short description com base This dashboard is designed to work with OpenTelemetry (OTEL) metrics instead of direct /metrics Prometheus scraping. This way, you don’t need to configure scraping for all your services—just set up the OTEL collector to remote write to Prometheus or expose the OpenTelemetry instance /metrics endpoint. See this example
Telemetry FastAPI application Dashboard with three pillars of observability on Grafana:
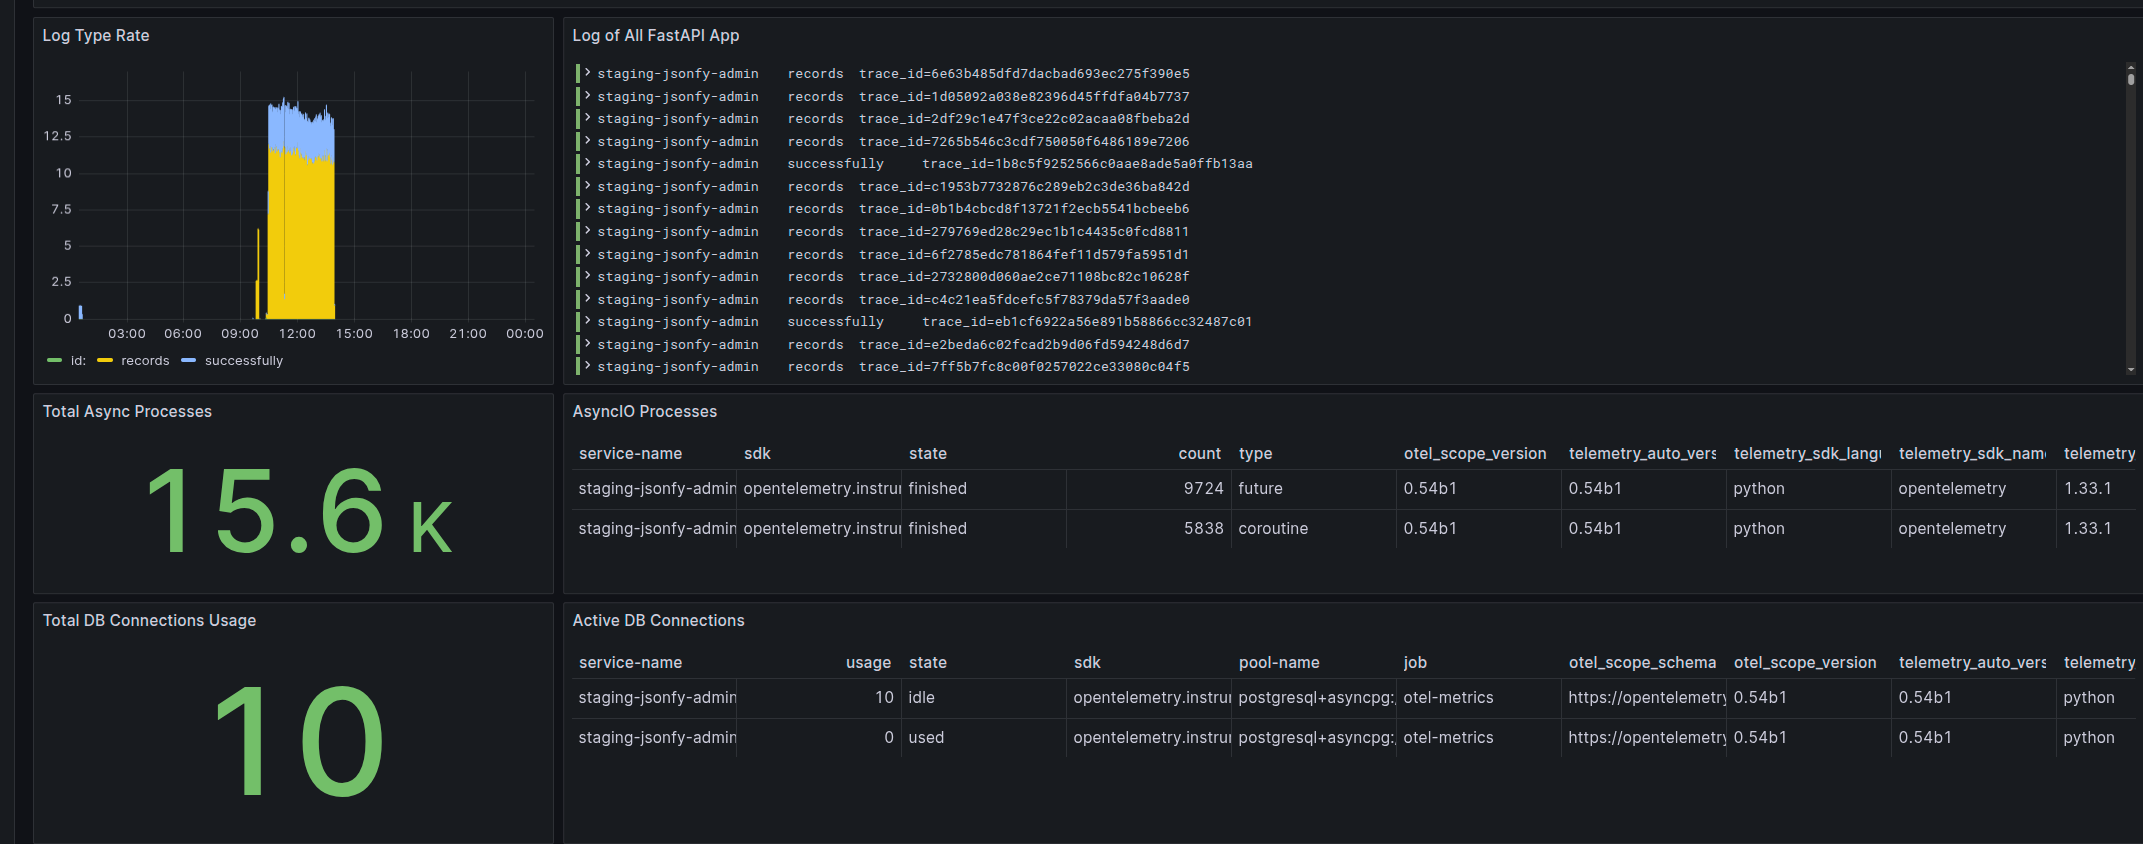
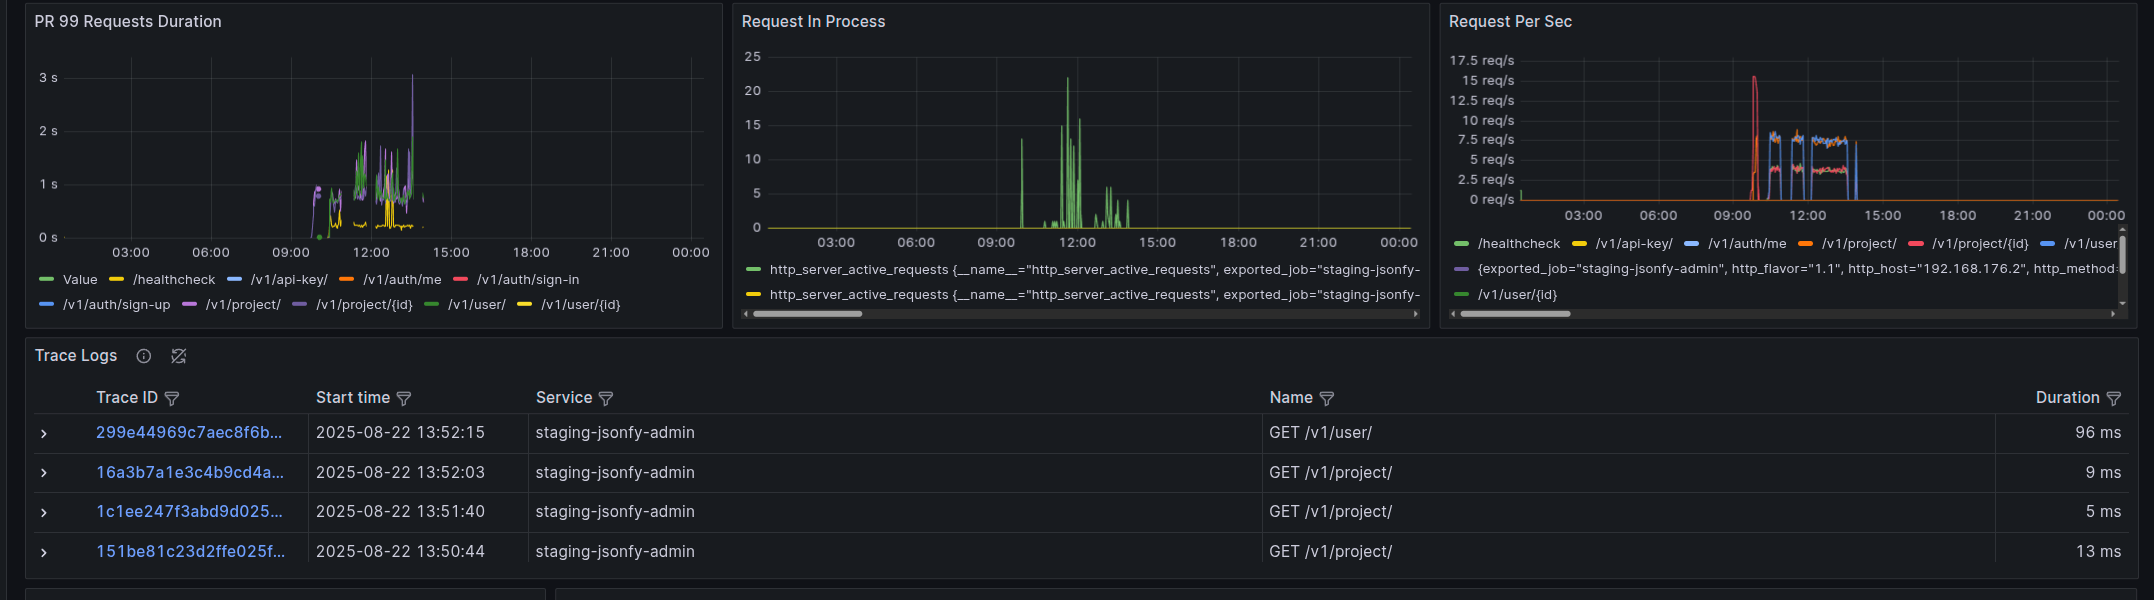
- Traces with Tempo and OpenTelemetry Python SDK
- Metrics with Prometheus and opentelemetry-client
- Logs with Loki
The project also includes instructions on:
- How to configure Grafana LGTM to store data in S3, making it easy to persist and manage your observability data.
- An optimized (190mb) Python FastAPI Dockerfile with automatic OpenTelemetry instrumentation.
- Decorator class to automatically open traces inside your code, so you don’t need to manually handle multiple with statements (works for both functions and classes).
- A complete Docker Compose setup with Grafana LGTM and individual configuration files, making it easy to set up your monitoring stack.
Check more details on the GitHub repository: [fastapi-automatic-otel-lgtm-s3](https://github.com/gabszs/fastapi-automatic-otel-lgtm-s3
Data source config
Collector config:
Upload an updated version of an exported dashboard.json file from Grafana
| Revision | Description | Created | |
|---|---|---|---|
| Download |