
Kaspa Node Monitoring Dashboard
Kaspa Node Monitoring Dashboard with DAG Metrics, Network Health, and Performance Insights
Kaspa Node Monitoring Dashboard
A comprehensive Grafana dashboard for monitoring Kaspa blockchain nodes with real-time metrics and health indicators.
Features
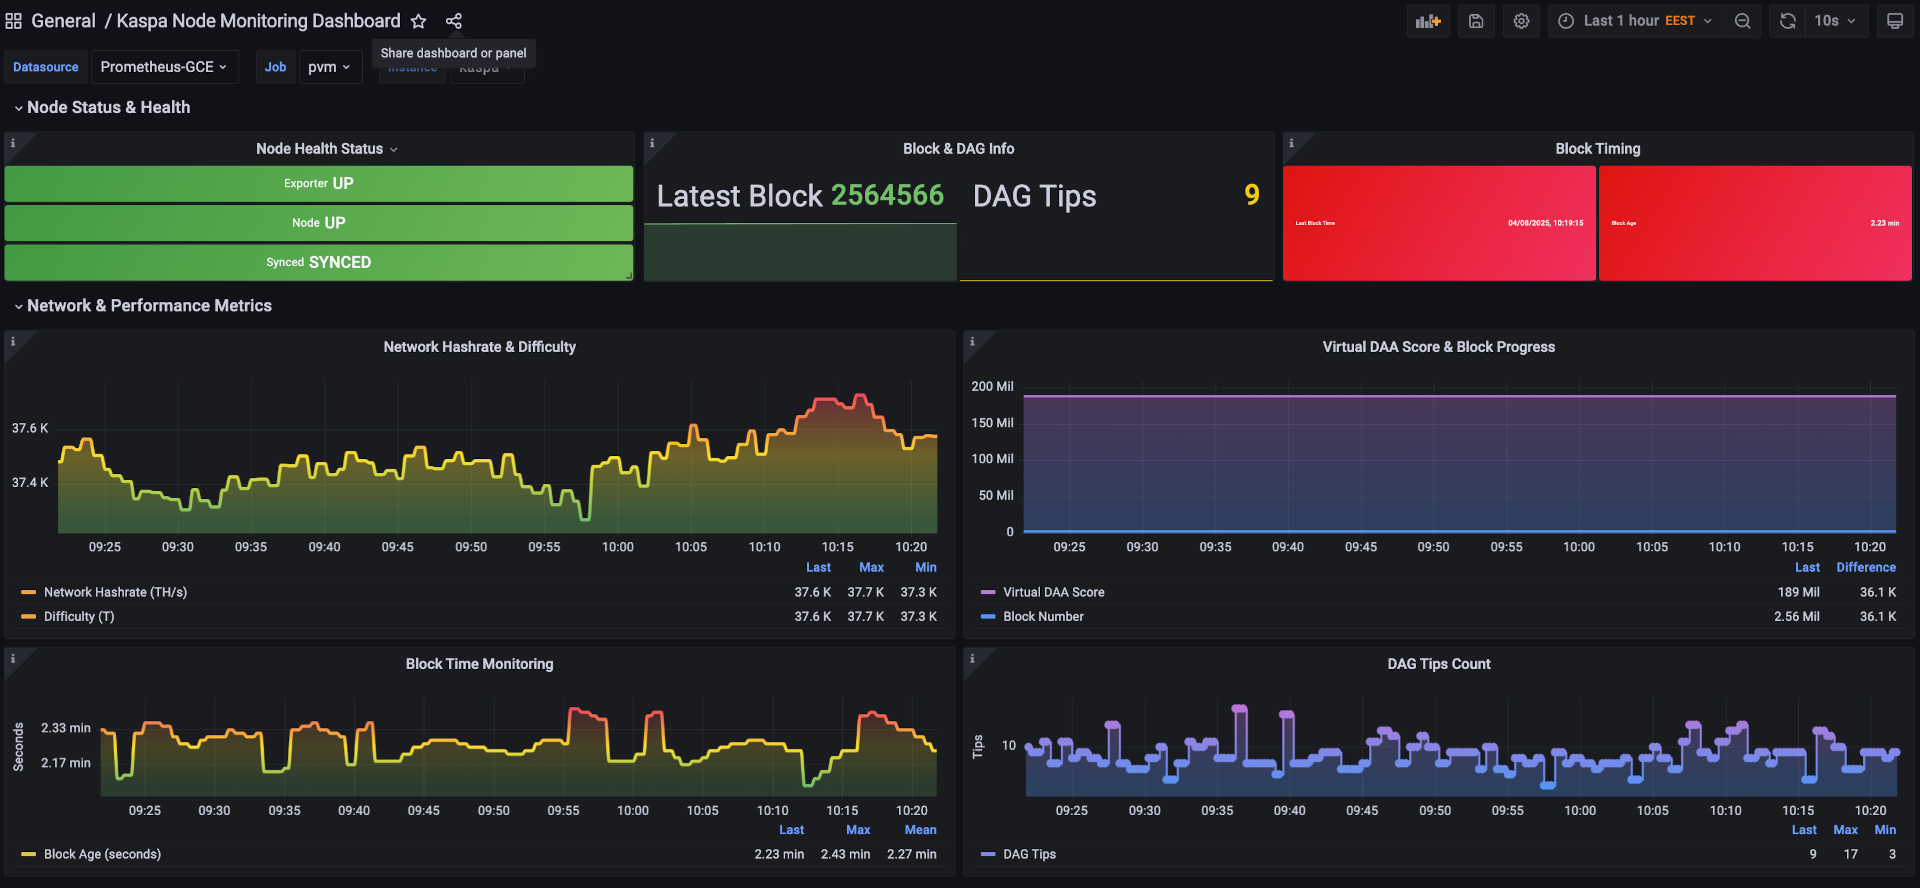
📊 Core Metrics
- Node Health Status - Exporter, node responsiveness, and sync status
- Block & DAG Info - Latest block numbers and DAG tips count
- Block Timing - Last block timestamp and time since last block
🌐 Network Metrics
- Network Hashrate & Difficulty - Real-time network security metrics
- Virtual DAA Score - Key Kaspa metric showing cumulative work
- Block Time Monitoring - Network performance indicators
- DAG Tips Count - Parallel block creation health
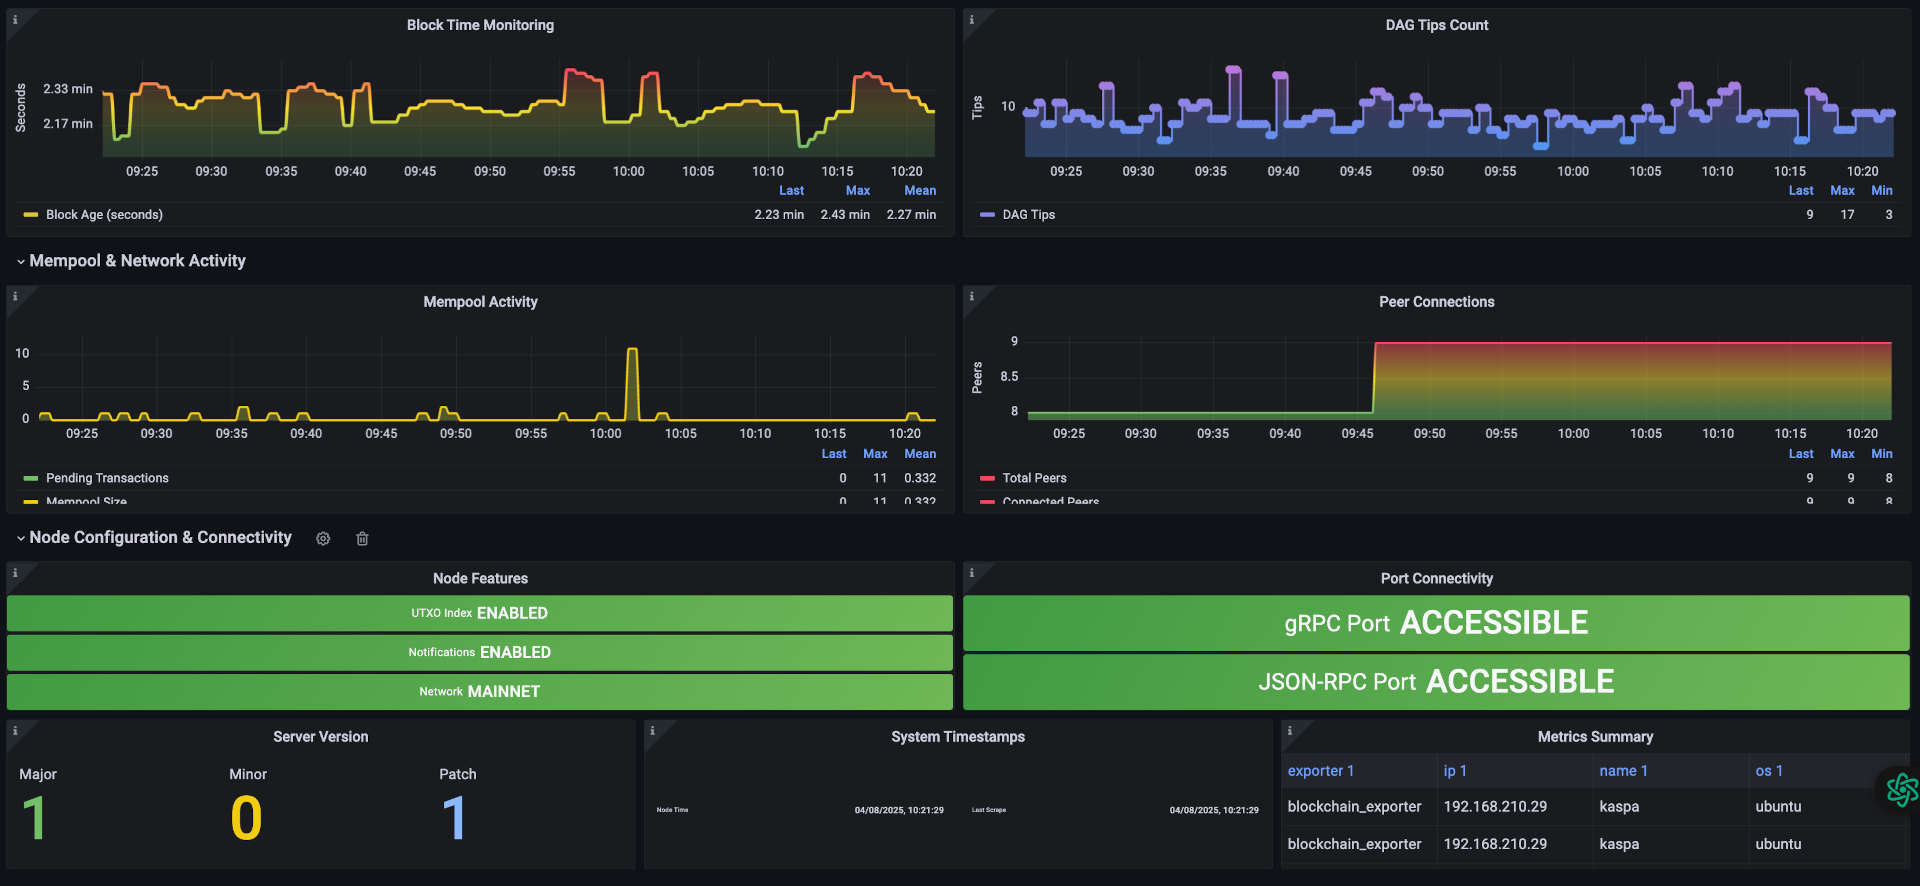
🔄 Activity Monitoring
- Mempool Activity - Pending transactions and mempool size
- Peer Connections - Network connectivity status
- Port Connectivity - gRPC and JSON-RPC port accessibility
⚙️ Configuration
- Node Features - UTXO index, notifications, network type
- Server Version - Version information display
- System Timestamps - Monitoring and health timestamps
Requirements
- Grafana 8.0+ (tested with 10.0+)
- Prometheus data source
- Kaspa Prometheus Exporter running
Installation
- Import the dashboard JSON into Grafana
- Configure your Prometheus datasource
- Set the appropriate job and instance variables
- Customize time ranges and refresh intervals as needed
Variables
- Datasource - Select your Prometheus instance
- Job - Prometheus job name for Kaspa exporter
- Instance - Specific Kaspa node instance
Alerts
Configure alerts based on key metrics:
- Node sync status (
kaspa_is_synced) - Block age (
kaspa_block_time_seconds > 30) - Peer count (
kaspa_connected_peer_count < 3)
Troubleshooting
- Ensure the Kaspa exporter is running and accessible
- Verify Prometheus is scraping the exporter endpoint
- Check that the Kaspa node JSON-RPC port (default 18110) is accessible
Dashboard Sections
- Node Status & Health - Critical status indicators
- Network & Performance - Blockchain performance metrics
- Mempool & Network Activity - Transaction and peer data
- Node Configuration & Connectivity - System configuration
Perfect for monitoring Kaspa mining operations, node health, and network participation.
Data source config
Collector type:
Collector plugins:
Collector config:
Revisions
Upload an updated version of an exported dashboard.json file from Grafana
| Revision | Description | Created | |
|---|---|---|---|
| Download |
Linux Server
Monitor Linux with Grafana. Easily monitor your Linux deployment with Grafana Cloud's out-of-the-box monitoring solution.
Learn more