
Loki Logging Volume Analysis
Comprehensive monitoring dashboard for Loki log ingestion and analysis. Tracks log volume patterns across containers and namespaces, identifies top log producers, monitors error rates, and provides real-time insights into logging infrastructure health. Features include top 10 containers/namespaces by log rate, error rate tracking, total ingestion metrics, and detailed tabular view of current log producers. Essential for troubleshooting high-volume logging, capacity planning, and identifying problematic services generating excessive logs or errors.
Loki Logging Volume Analysis Dashboard
Overview
This dashboard provides comprehensive monitoring and analysis of log ingestion patterns using Grafana Loki. It helps identify logging bottlenecks, track error rates, and monitor resource consumption across your containerized infrastructure.
What This Dashboard Shows
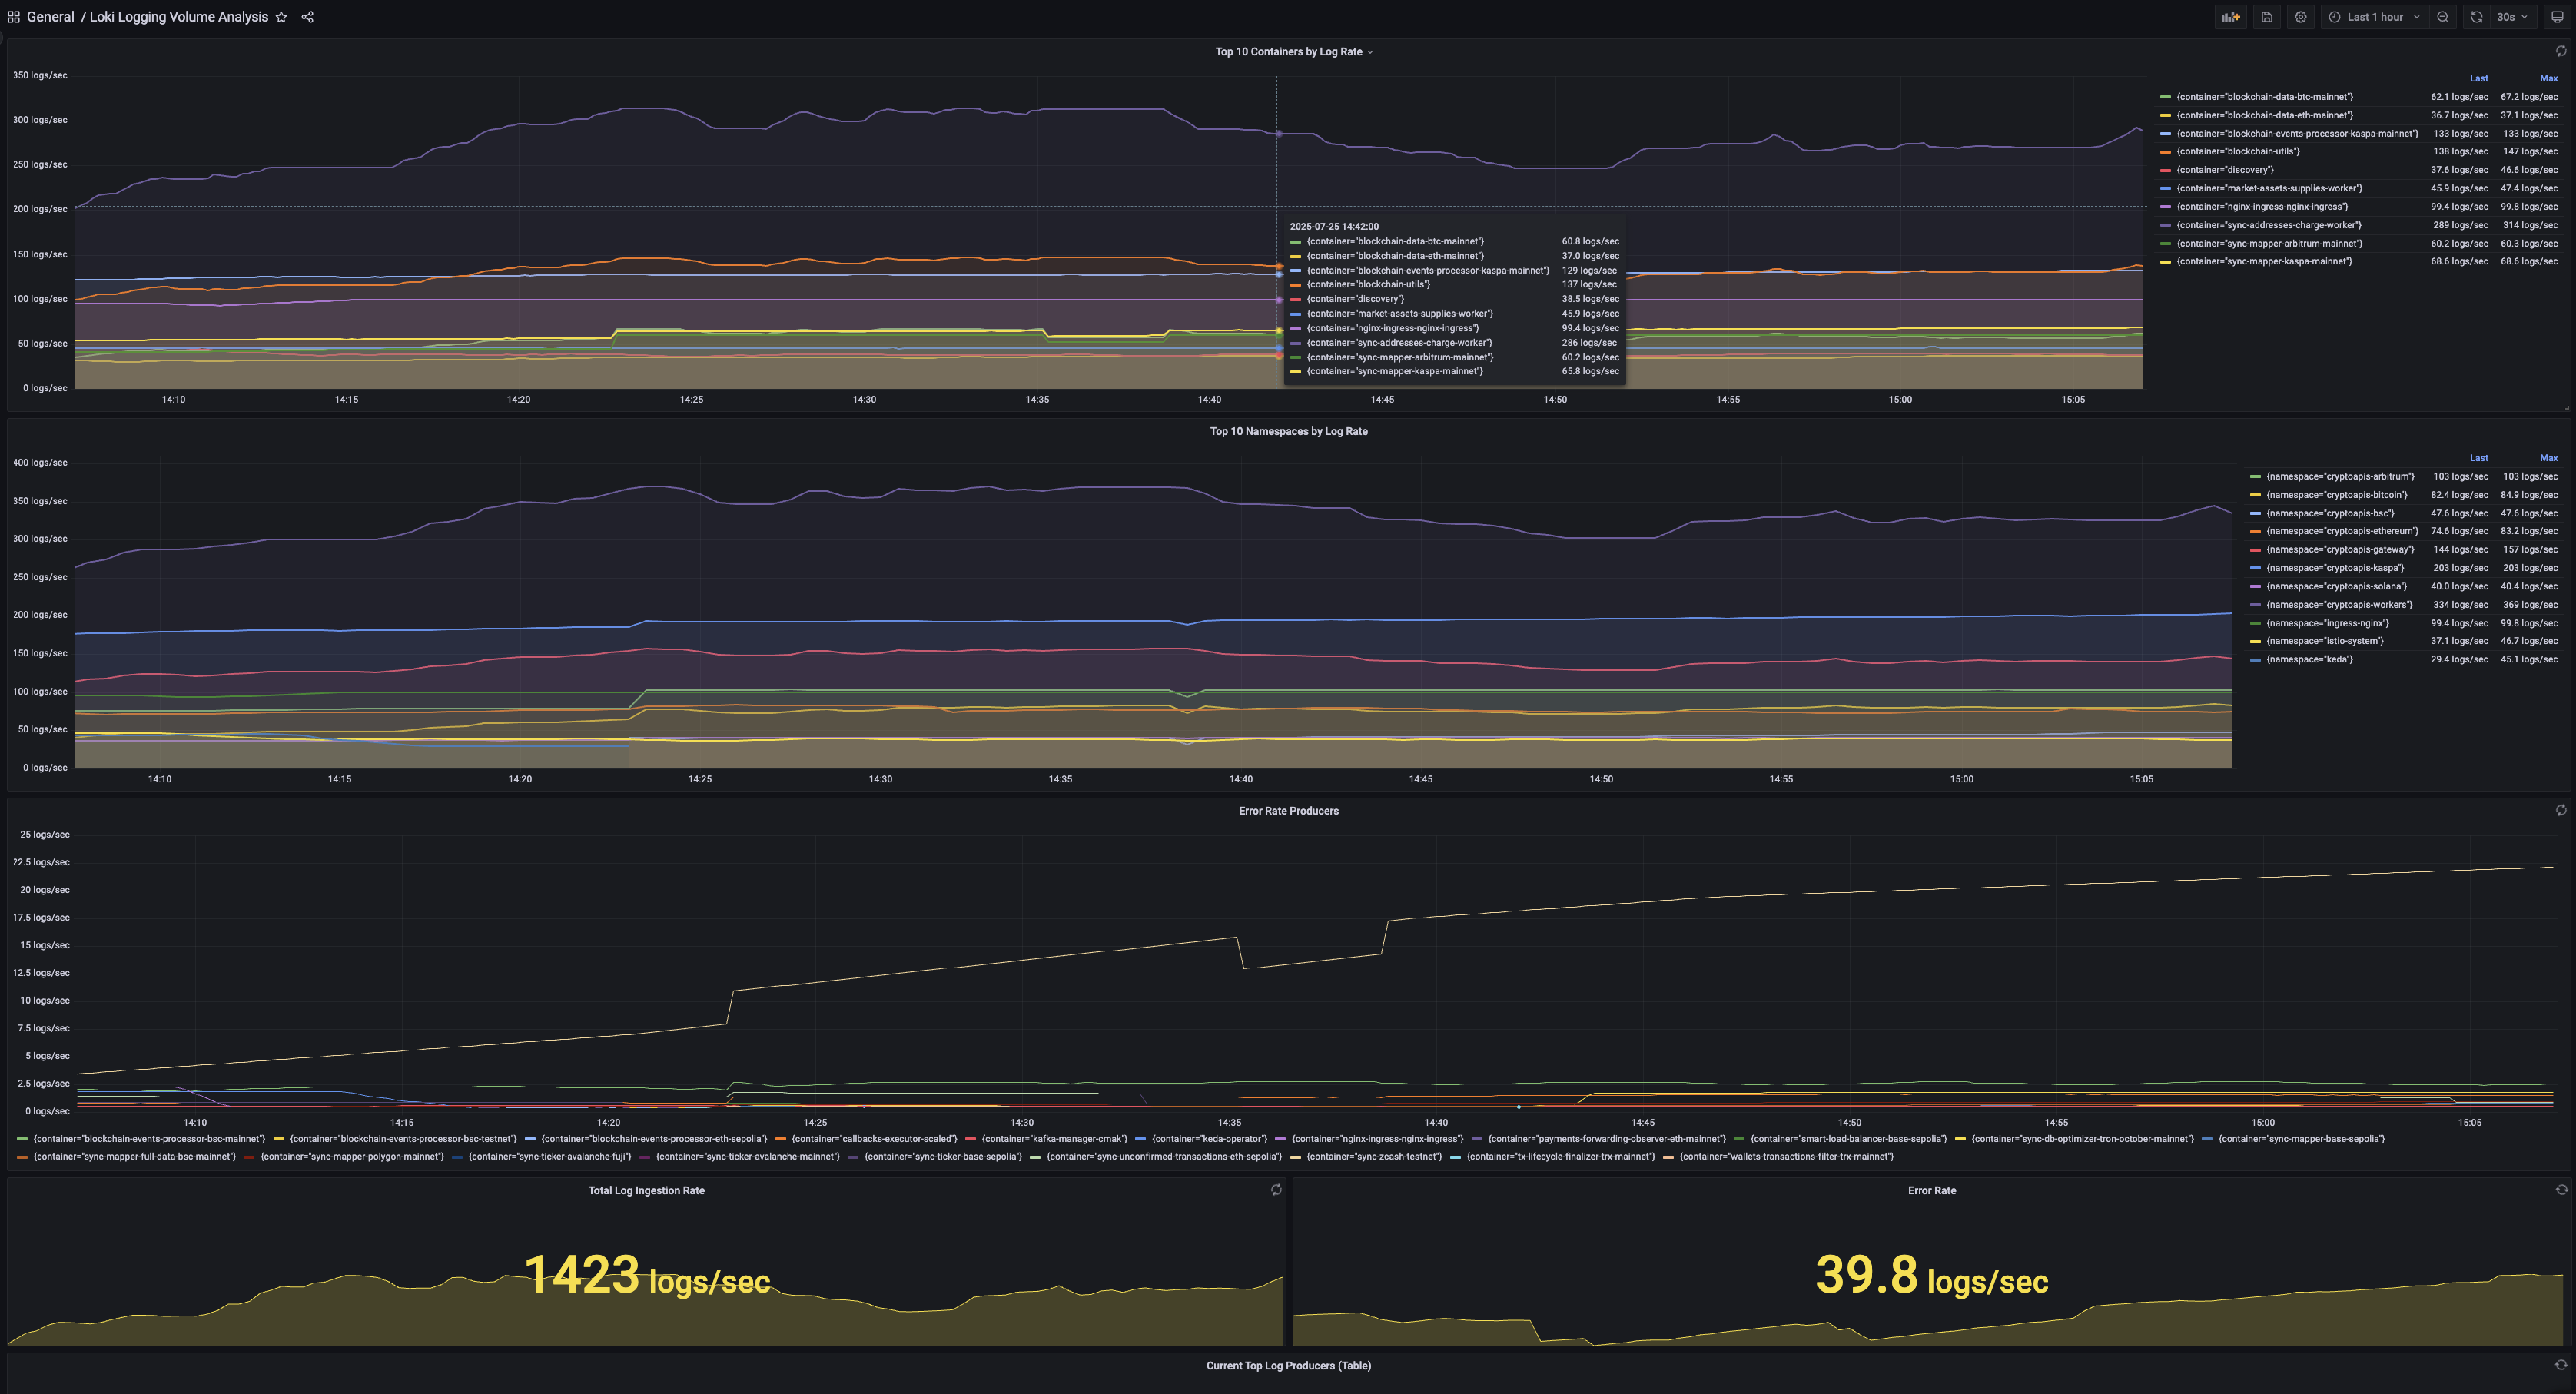
📊 Top 10 Containers by Log Rate
- Identifies the highest log-producing containers in your cluster
- Shows trends over time to spot unusual spikes
- Useful for capacity planning and identifying chatty applications
🏢 Top 10 Namespaces by Log Rate
- Monitors log volume at the namespace level
- Helps with resource allocation and team accountability
- Enables cross-team visibility into logging patterns
🚨 Error Rate Producers
- Tracks containers generating the most error logs
- Uses case-insensitive regex matching for "error" patterns
- Critical for identifying problematic services quickly
📈 Total Log Ingestion Rate
- Real-time overview of overall system log throughput
- Color-coded thresholds (Green < 1K, Yellow < 5K, Red > 5K logs/sec)
- Essential for monitoring Loki cluster health
⚠️ Error Rate
- Aggregated error log rate across all containers
- Immediate visibility into system-wide issues
- Thresholds: Green < 10, Yellow < 50, Red > 50 errors/sec
📋 Current Top Log Producers (Table)
- Detailed tabular view with namespace, container, and pod breakdown
- Sortable by log rate with gradient gauge visualization
- Shows top 20 log producers for granular analysis
Data Collection
Prerequisites
- Loki: Centralized log aggregation system
- Promtail or similar log collector configured to ship logs to Loki
- Container logs labeled with
container,namespace, andpodlabels
Log Collection Setup
This dashboard expects logs to be collected with the following label structure:
# Example Promtail configuration snippet
scrape_configs:
  - job_name: kubernetes-pods
    kubernetes_sd_configs:
      - role: pod
    relabel_configs:
      - source_labels: [__meta_kubernetes_pod_container_name]
        target_label: container
      - source_labels: [__meta_kubernetes_namespace]
        target_label: namespace
      - source_labels: [__meta_kubernetes_pod_name]
        target_label: pod
Query Patterns
The dashboard uses LogQL queries with rate calculations:
rate({container=~".+"}[$__range])- Log ingestion rate per containerrate({container=~".+"} |~ "(?i)error" [$__range])- Error log detection using regex
Time Range Configuration
- Default Range: Last 5 minutes (
now-5mtonow) - Auto Refresh: 30 seconds
- Rate Calculation: Uses Grafana's
$__rangevariable for automatic interval adjustment
Use Cases
- Capacity Planning: Monitor ingestion trends to predict storage and processing needs
- Troubleshooting: Quickly identify services generating excessive logs or errors
- Cost Optimization: Find and optimize verbose applications to reduce log storage costs
- SLA Monitoring: Track error rates across services and namespaces
- Performance Analysis: Correlate log volume spikes with application performance issues
Alerts and Thresholds
The dashboard includes visual thresholds but doesn't create alerts. Consider setting up Grafana alerts for:
- Total ingestion rate > 5000 logs/sec
- Error rate > 50 errors/sec
- Individual container log rate > 1000 logs/sec
Dependencies
- Grafana: 9.3+ recommended
- Loki Datasource: Configured and accessible
- Log Labels: Requires
container,namespace, andpodlabels on log streams
Customization
To adapt this dashboard for your environment:
- Modify label selectors in queries to match your log stream labels
- Adjust threshold values based on your infrastructure scale
- Add additional error patterns in the regex filter
- Customize time ranges for your monitoring needs
Data source config
Collector config:
Upload an updated version of an exported dashboard.json file from Grafana
| Revision | Description | Created | |
|---|---|---|---|
| Download |
Grafana Loki (self-hosted)
Easily monitor Grafana Loki (self-hosted), a horizontally scalable, highly available, multi-tenant log aggregation system inspired by Prometheus, with Grafana Cloud's out-of-the-box monitoring solution.
Learn more