
CloudBees CI - Jenkins - Build Performance
Dashboard for monitoring CloudBees CI - Jenkins builds, pipelines and agents. Provides visibility into Build KPIs and Pipeline tracing from OTEL. This dashboard is compatible with HA/HS.
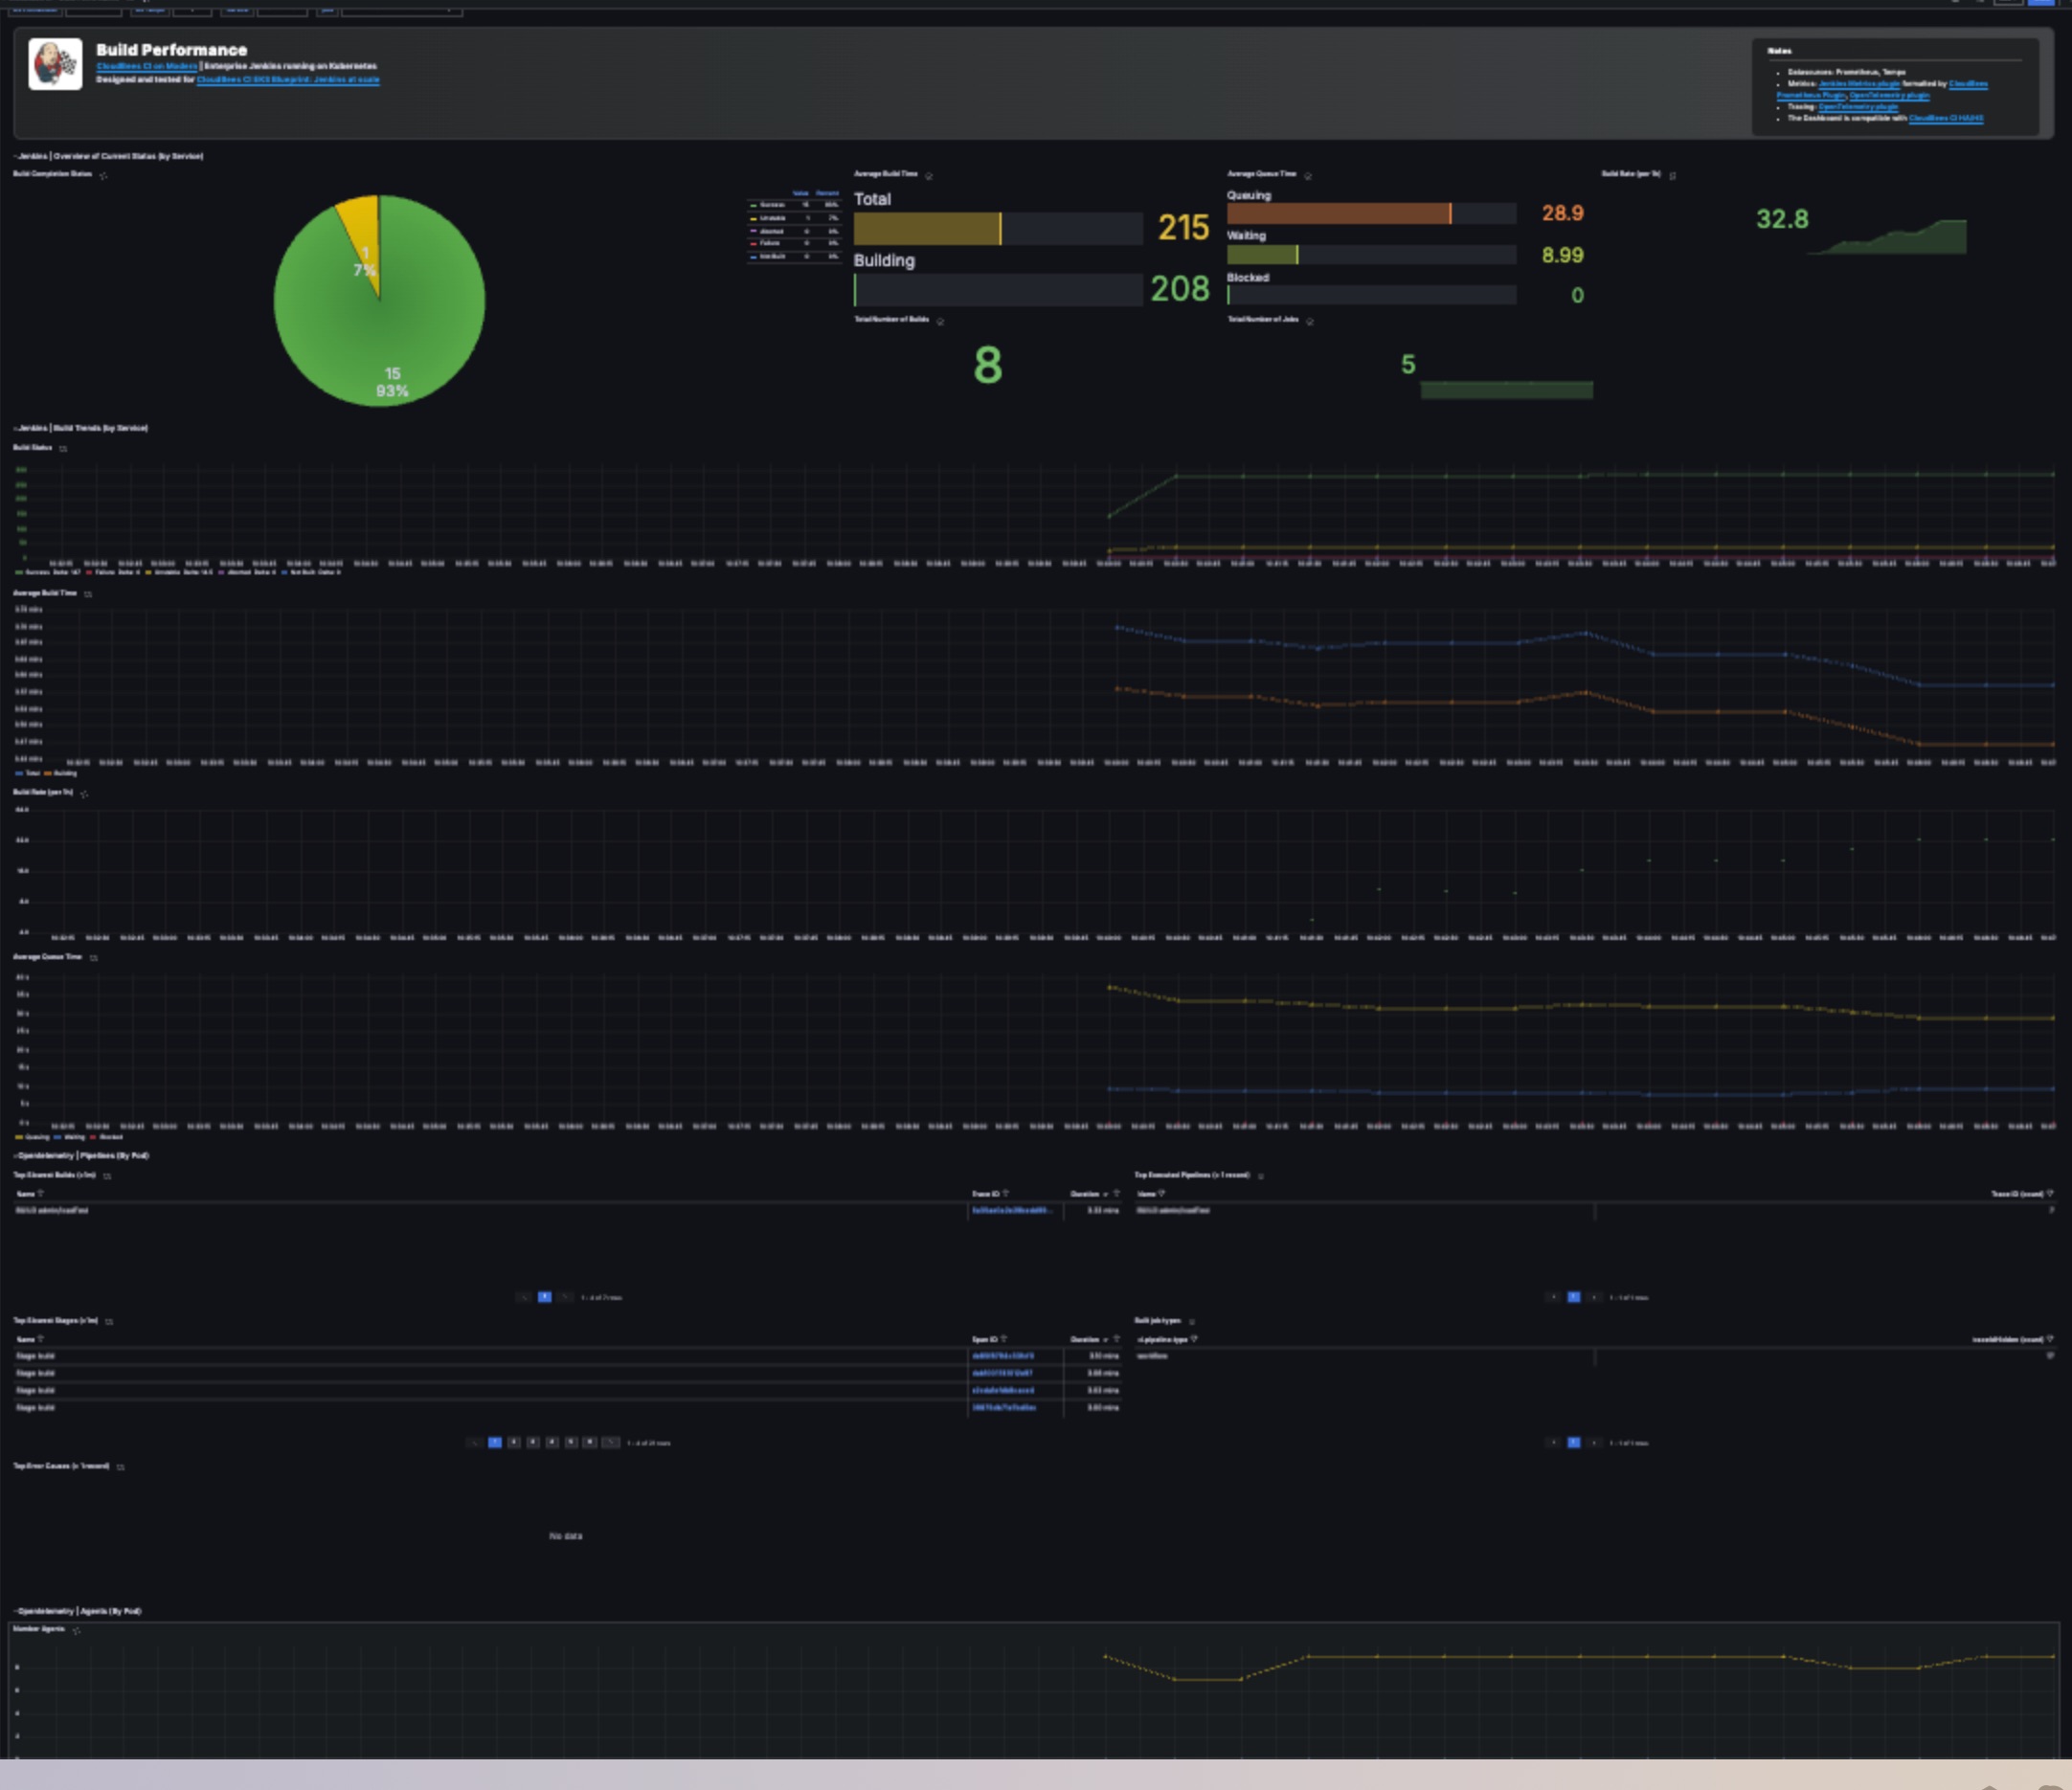
Build Performance for CloudBees CI on Modern, the Enterprise Jenkins running on Kubernetes.
This dashboard meets the API-REST consideration for CloudBees HA/HS.
Designed and tested for CloudBees CI EKS Blueprint: Jenkins at scale with the following set-up:
- Helm charts: CloudBees CI on Modern (Note: OSS users alternatively could use Jenkins), Kube-prometheus-stack - including kube-state-metrics.
- Jenkins plugins: CloudBees Prometheus plugin (Note: OSS users alternatively could use Jenkins Prometheus Plugin) and OpenTelemetry plugin.
- Data sources: Prometheus and Tempo
Data source config
Collector type:
Collector plugins:
Collector config:
Revisions
Upload an updated version of an exported dashboard.json file from Grafana
| Revision | Description | Created | |
|---|---|---|---|
| Download |
Jenkins
Easily monitor your deployment of Jenkins, the open source automation server, with Grafana Cloud's out-of-the-box monitoring solution.
Learn more