
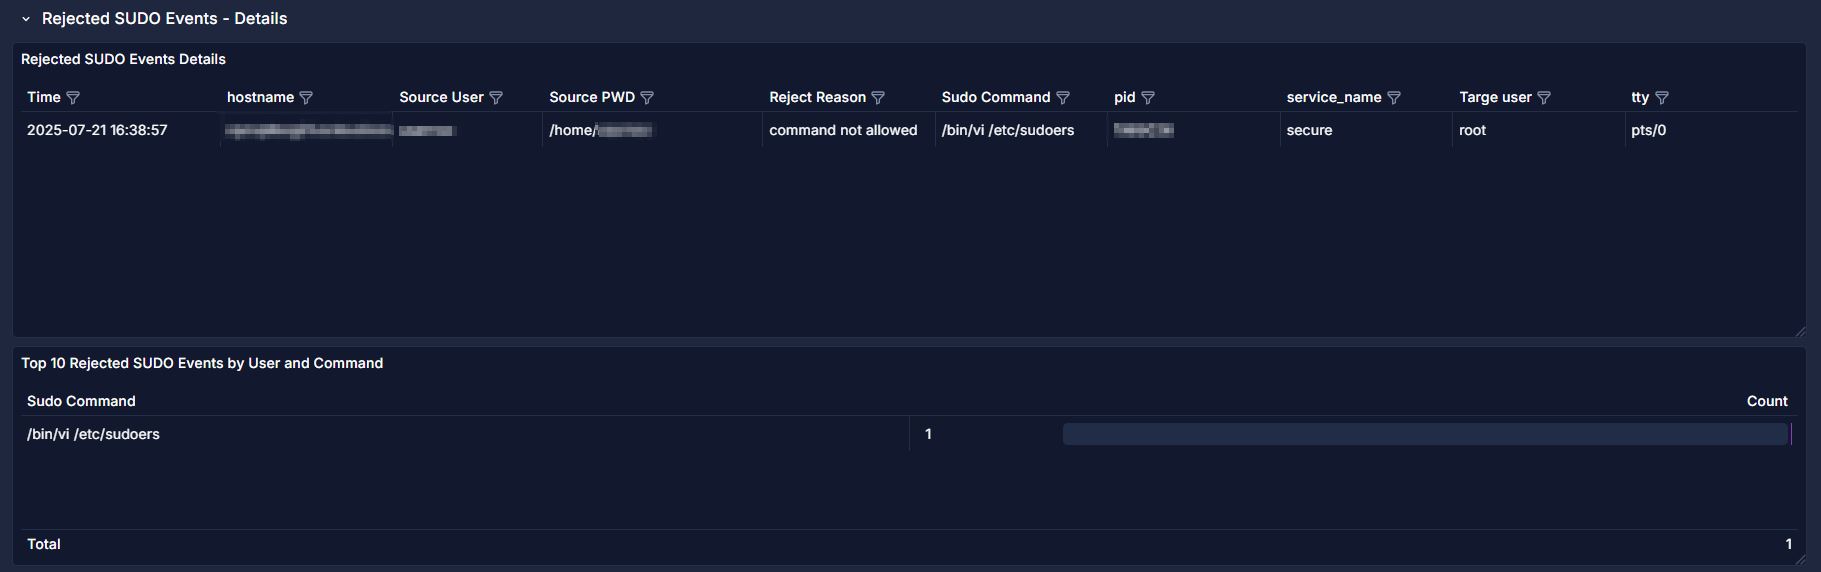
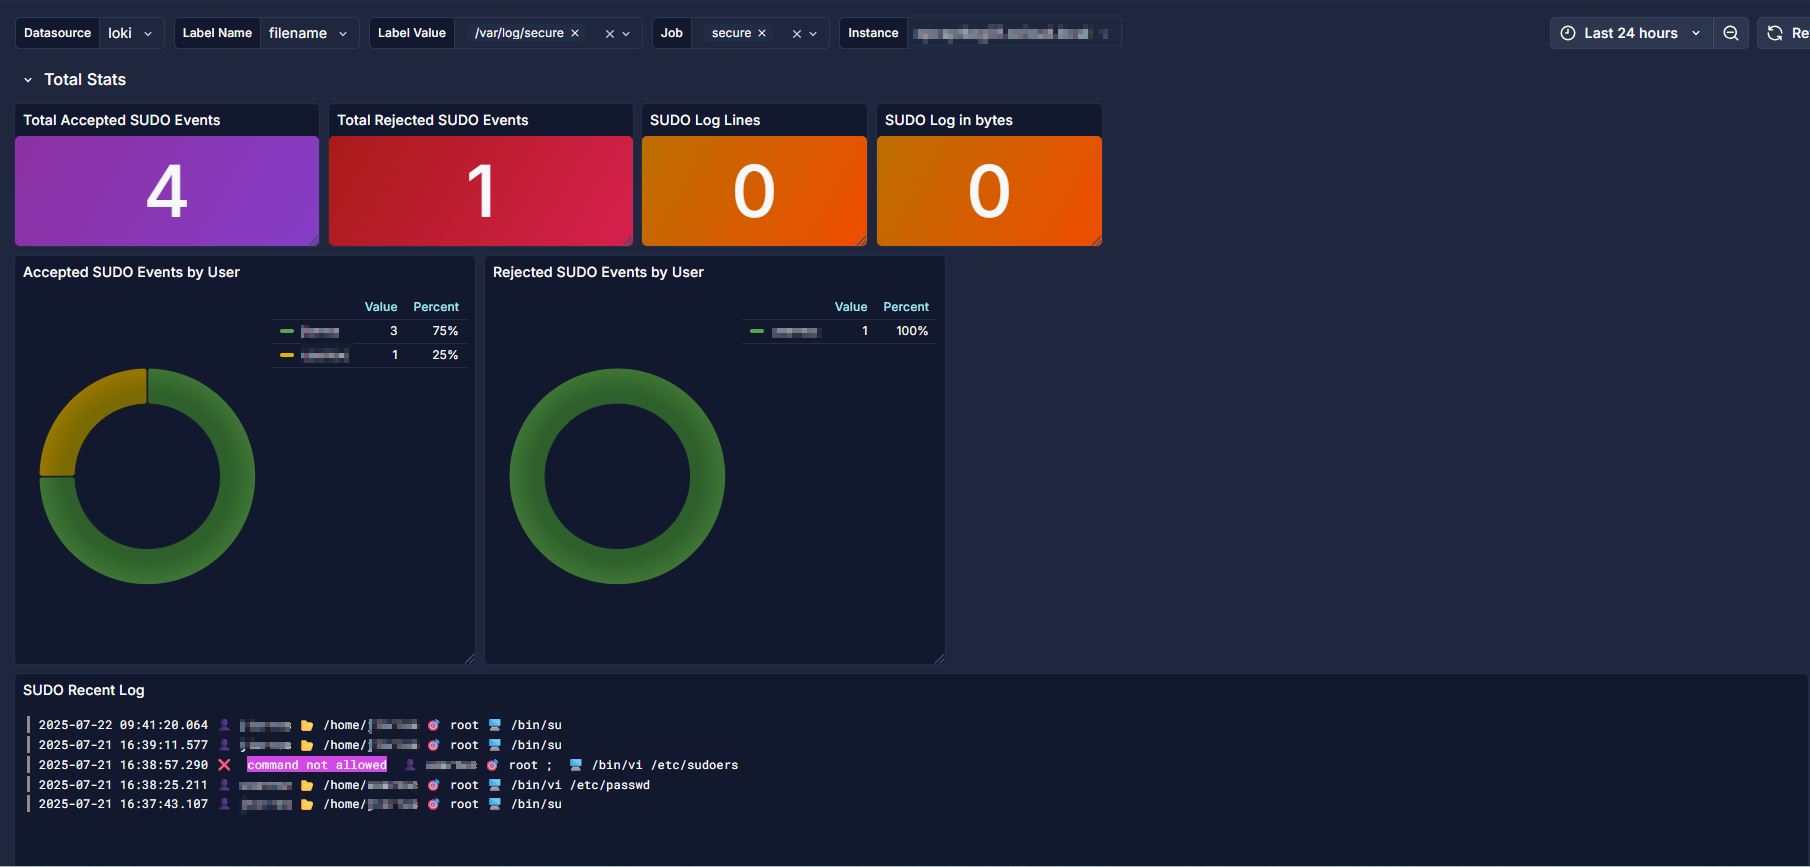
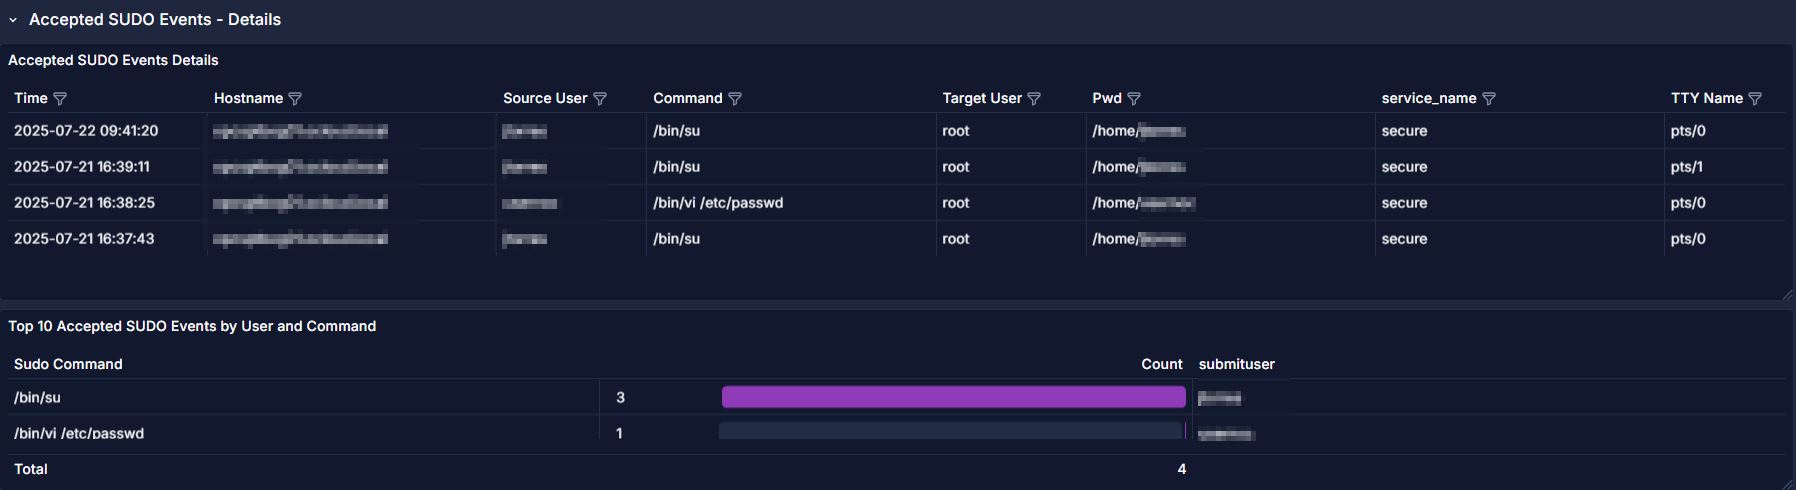
SUDO Logs
Monitor SUDO Logs with Alloy and Loki
This Dashboard is a version based in https://grafana.com/grafana/dashboards/19816-sudo-logs-json-version/ or https://github.com/voidquark/grafana-dashboards?tab=readme-ov-file#sudo-logs
However SUDO logs isn’t JSON format, they are native in plan text and used grafana alloy (before protmail) and loki for data source
Data source config
Collector type:
Collector plugins:
Collector config:
Revisions
Upload an updated version of an exported dashboard.json file from Grafana
| Revision | Description | Created | |
|---|---|---|---|
| Download |
Grafana Loki (self-hosted)
Easily monitor Grafana Loki (self-hosted), a horizontally scalable, highly available, multi-tenant log aggregation system inspired by Prometheus, with Grafana Cloud's out-of-the-box monitoring solution.
Learn more