
jmeter-dashboard-victoriametrics
Dashboard for Jmeter using Backend listener and VictoriaMetrics.
Dashboard for Jmeter using Backend listener and VictoriaMetrics.
Detailed information on GitHub.
This dashboard copies the functionality of jmeter-dashboard-influxdb. Rewritten for VictoriaMetrics with minor changes.
The dashboard contains:
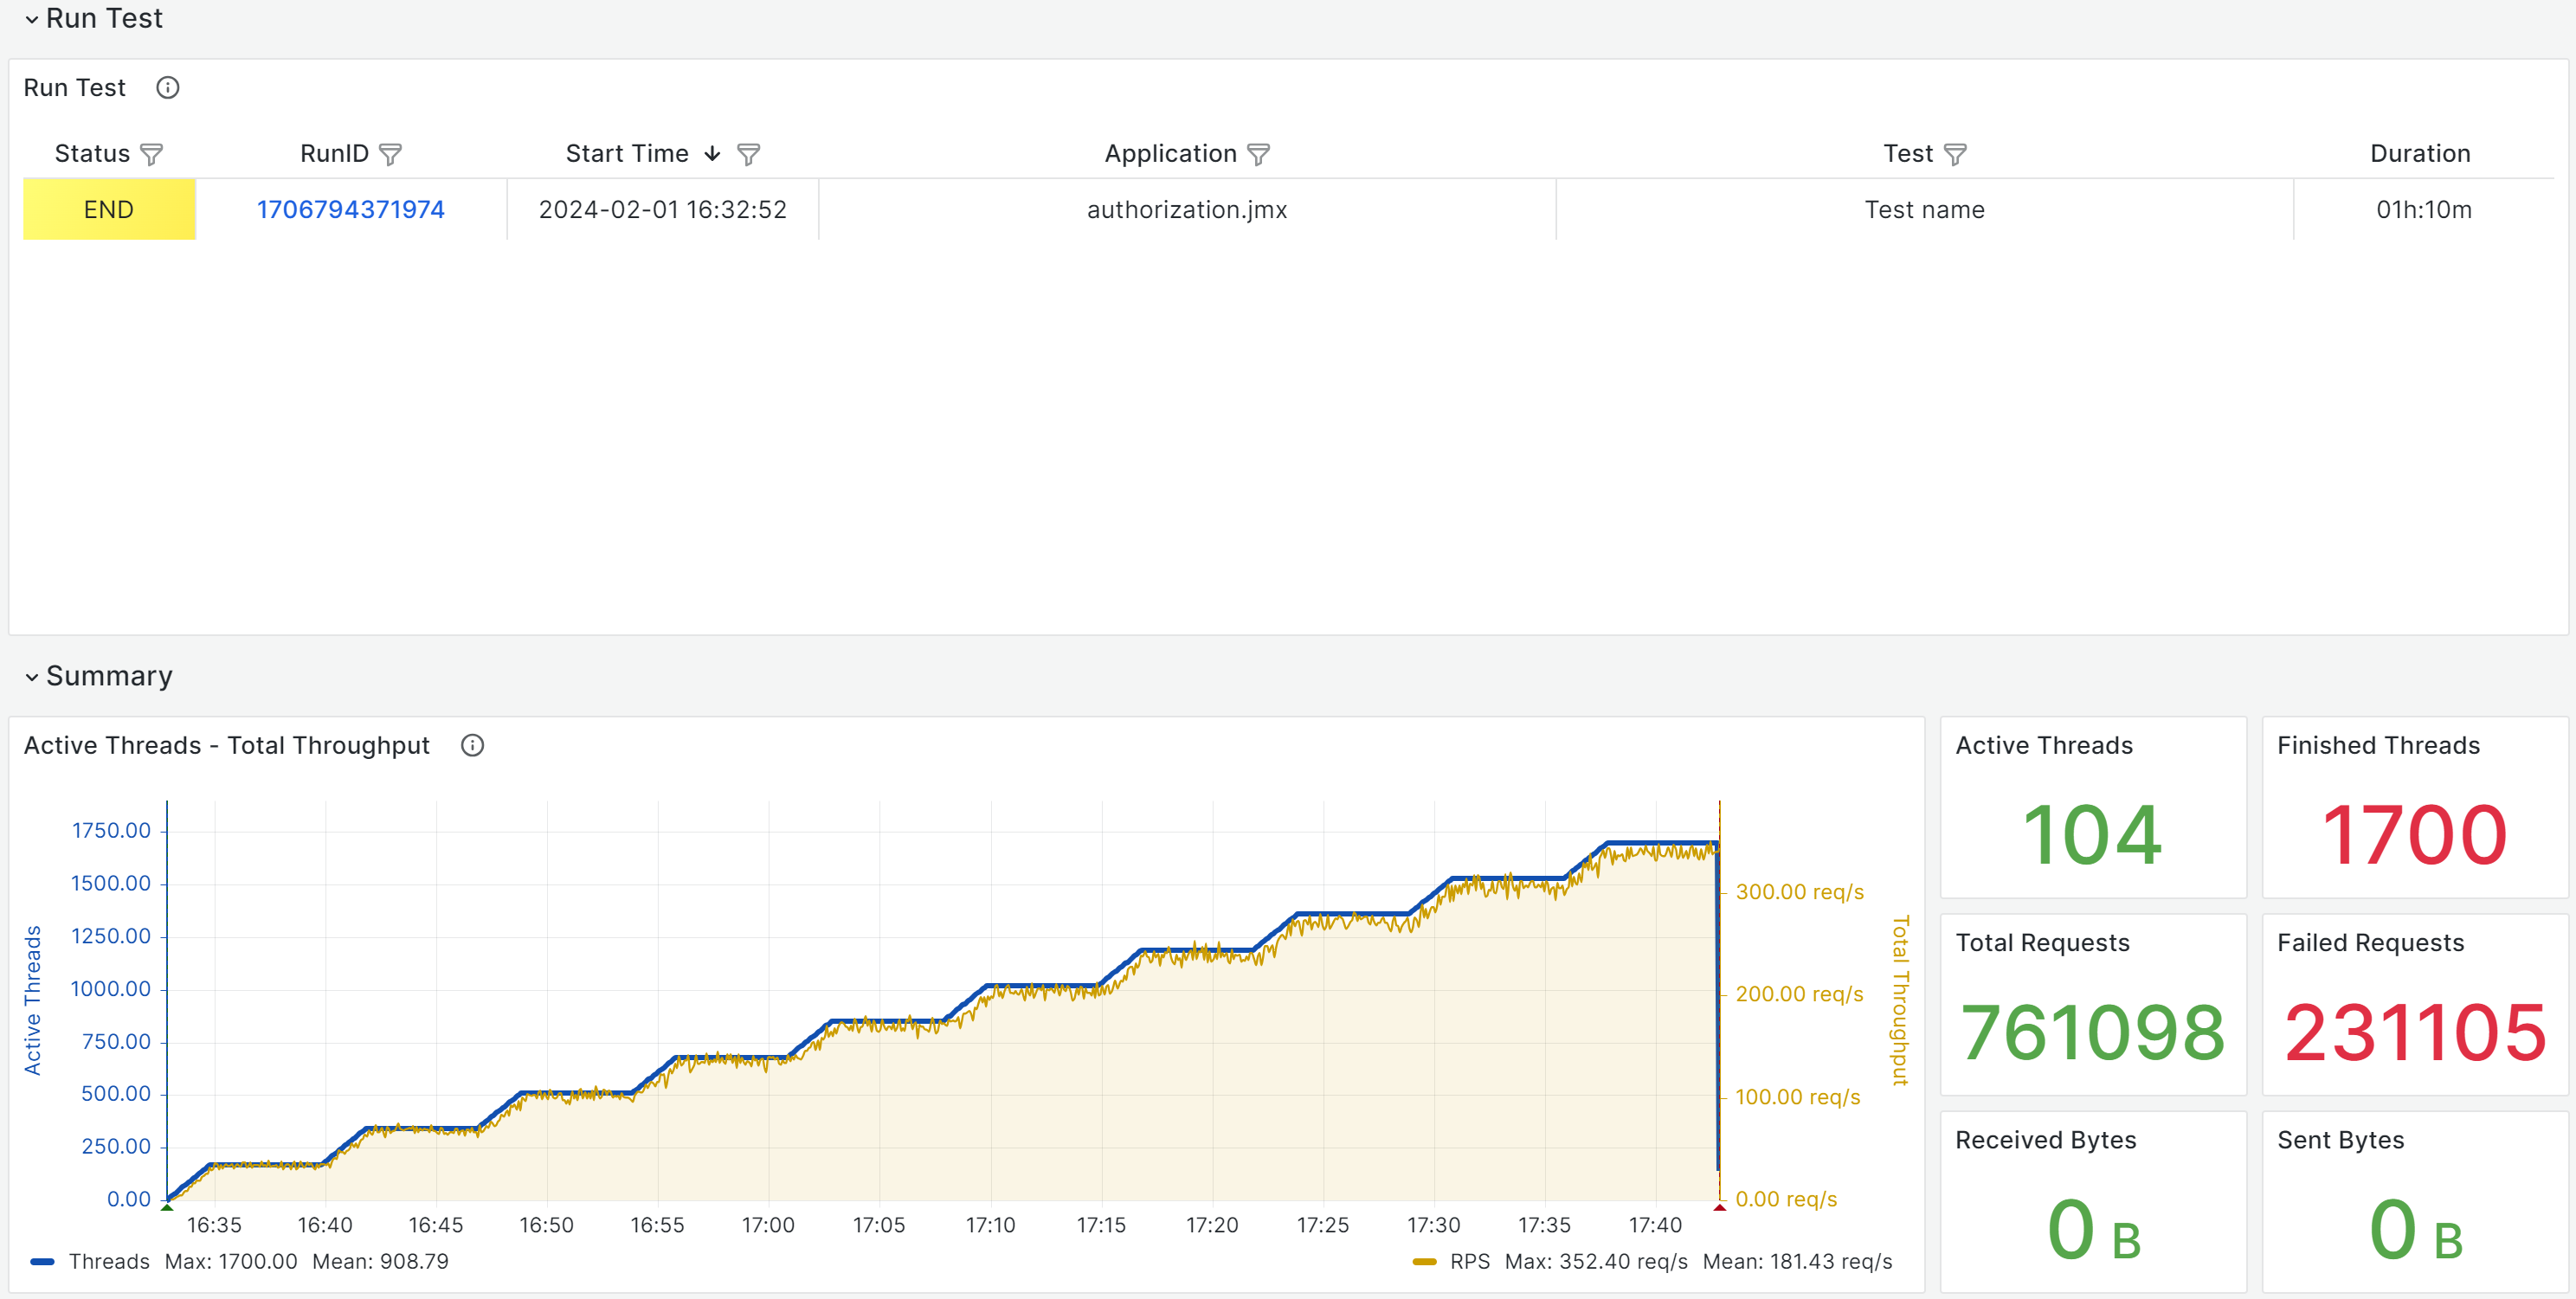
- Run Test - status of running / completed tests
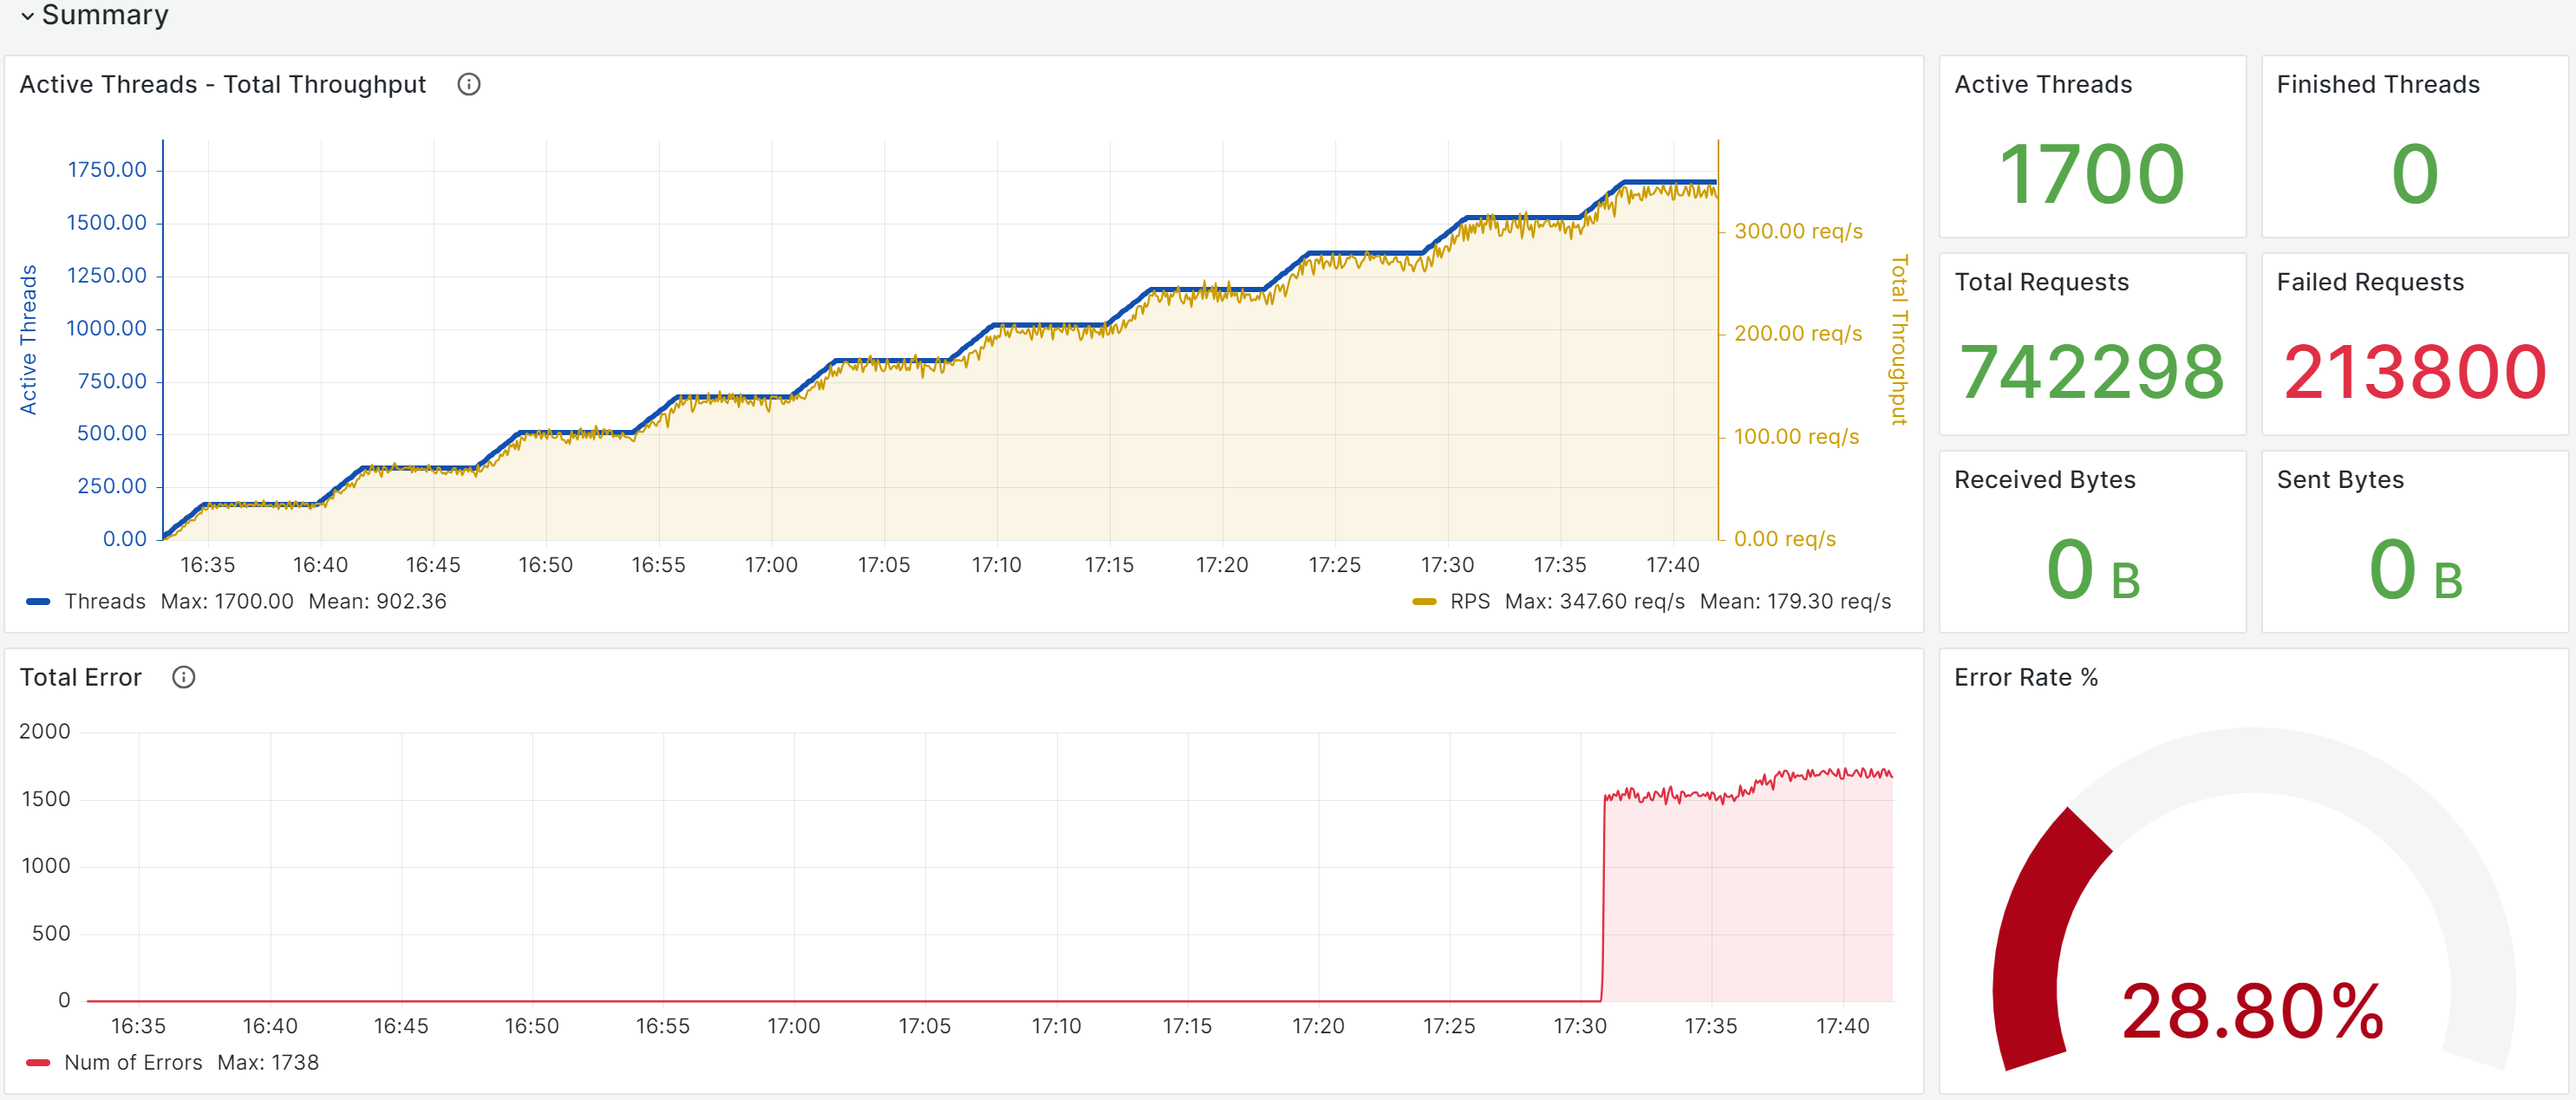
- Summary - basic information for analysis
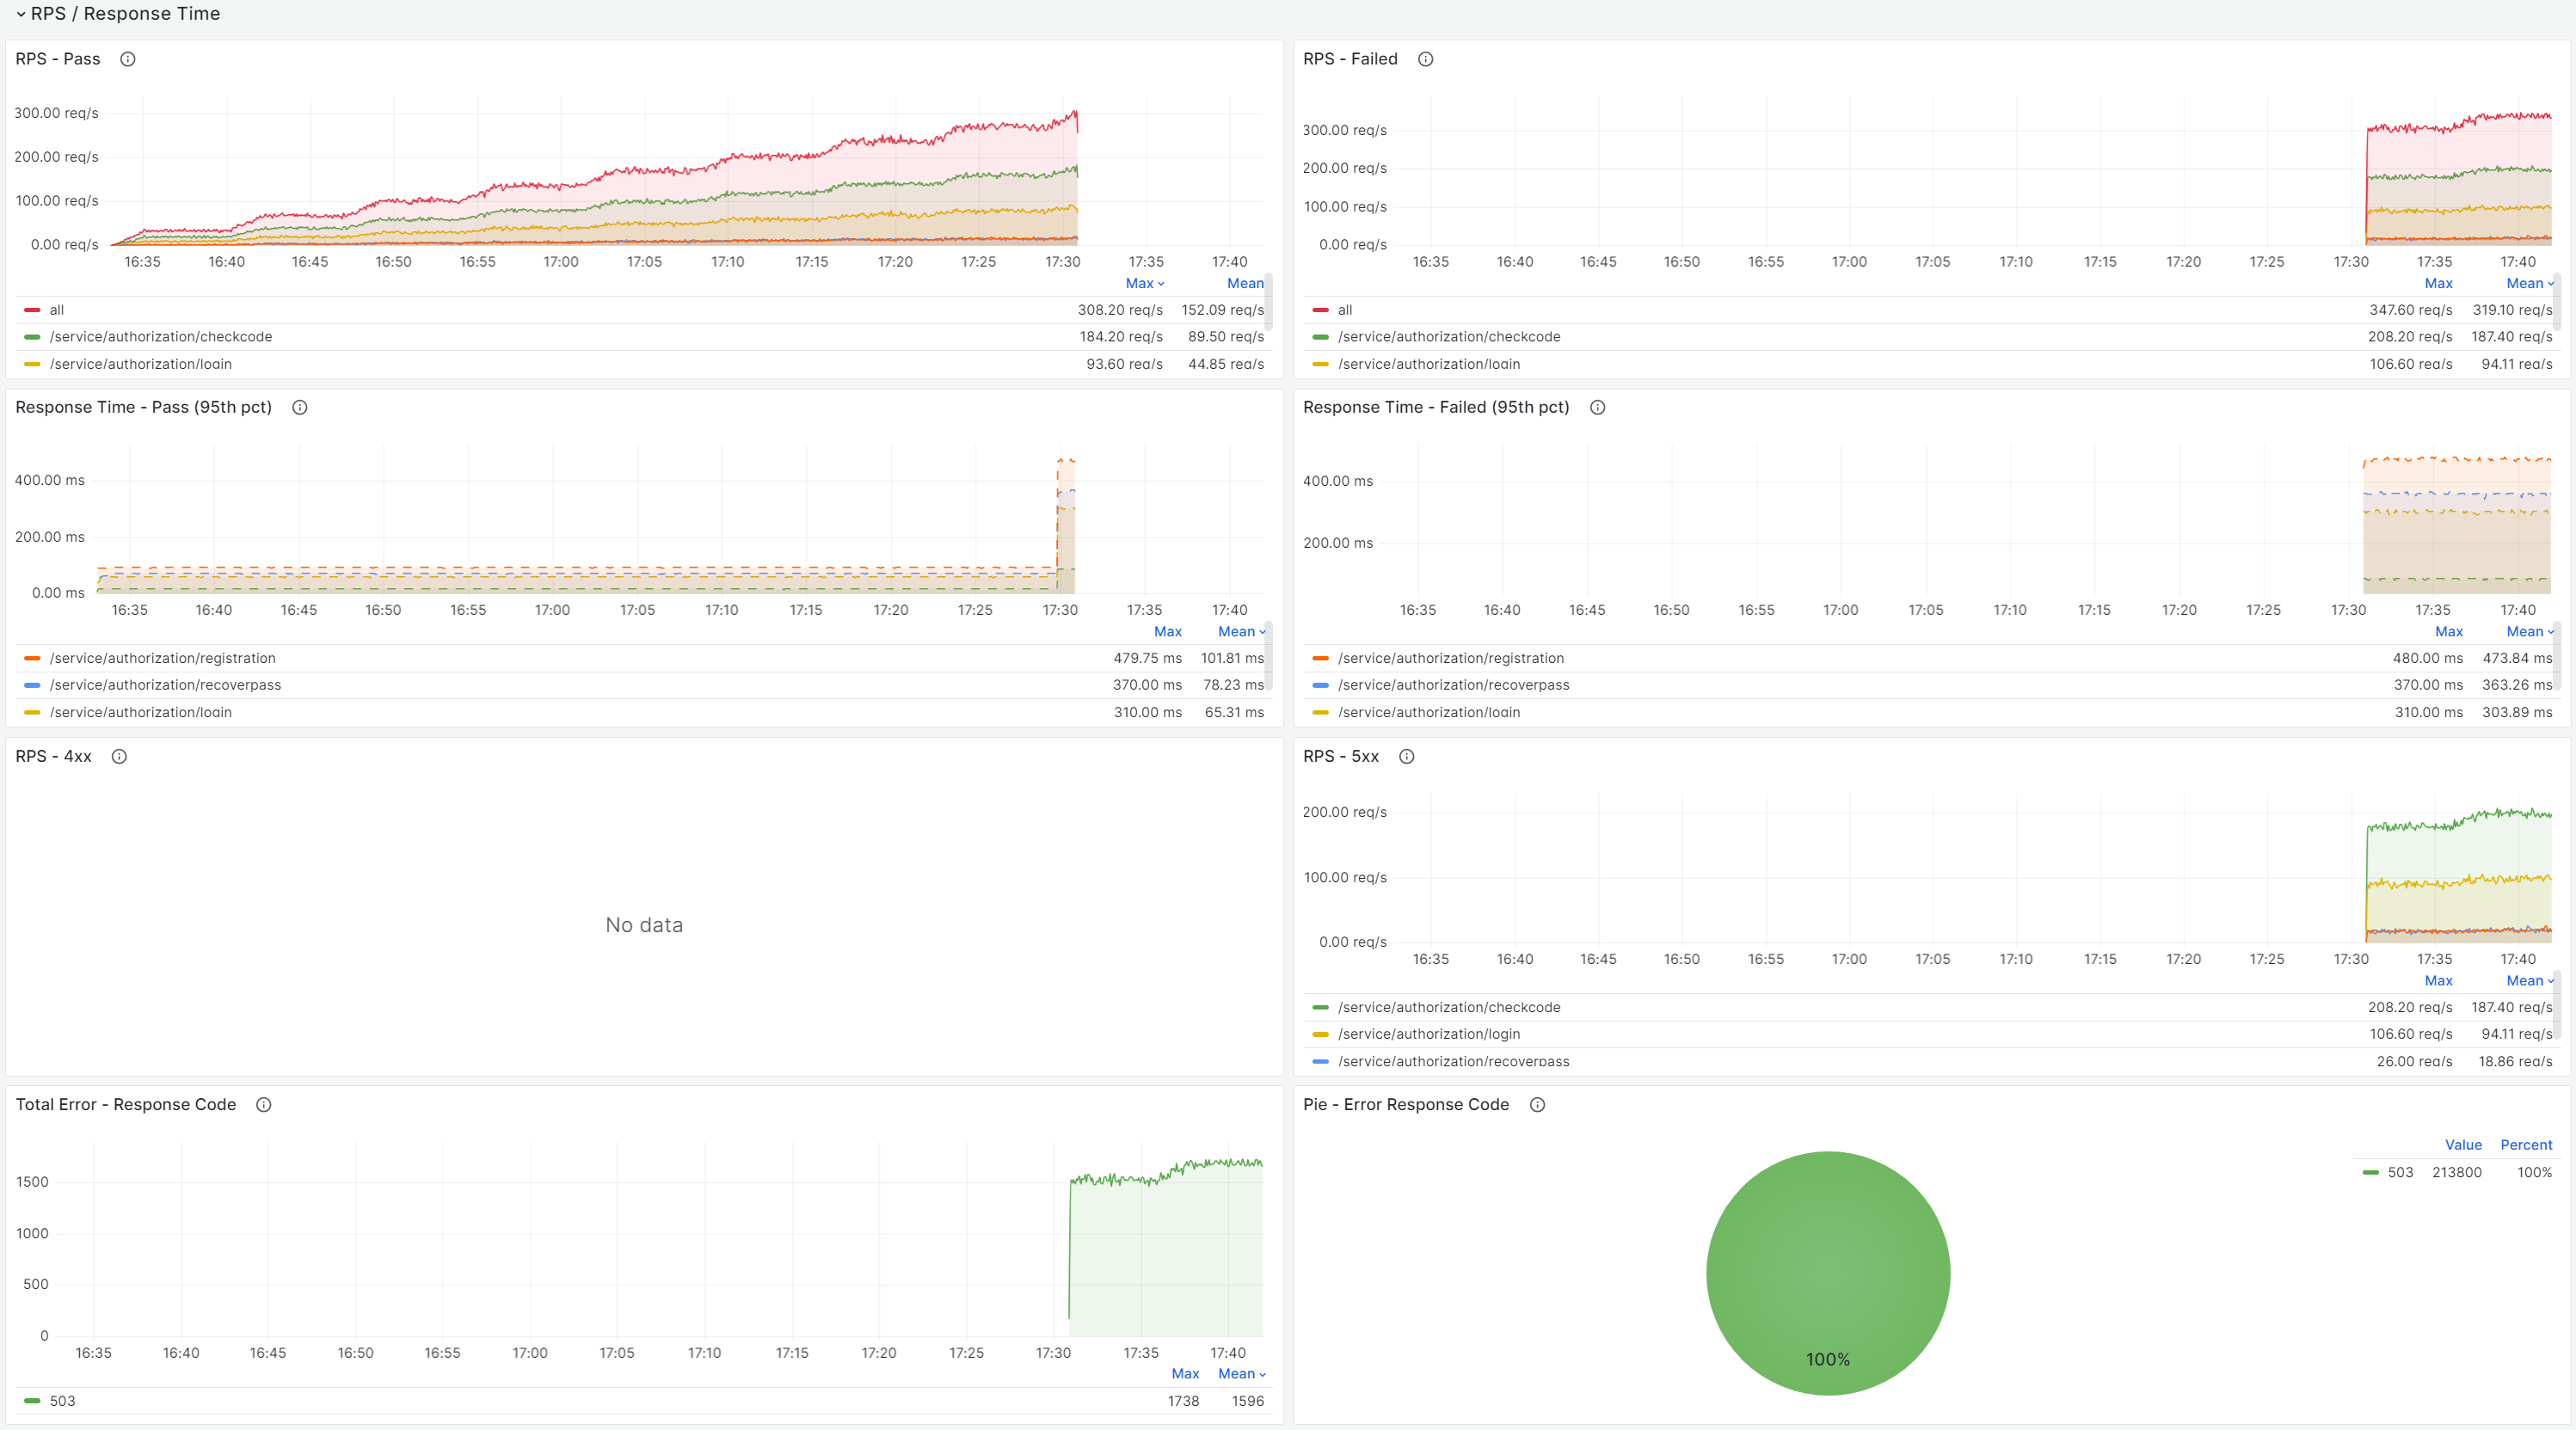
- RPS / Response Times - successful and unsuccessful requests, response times
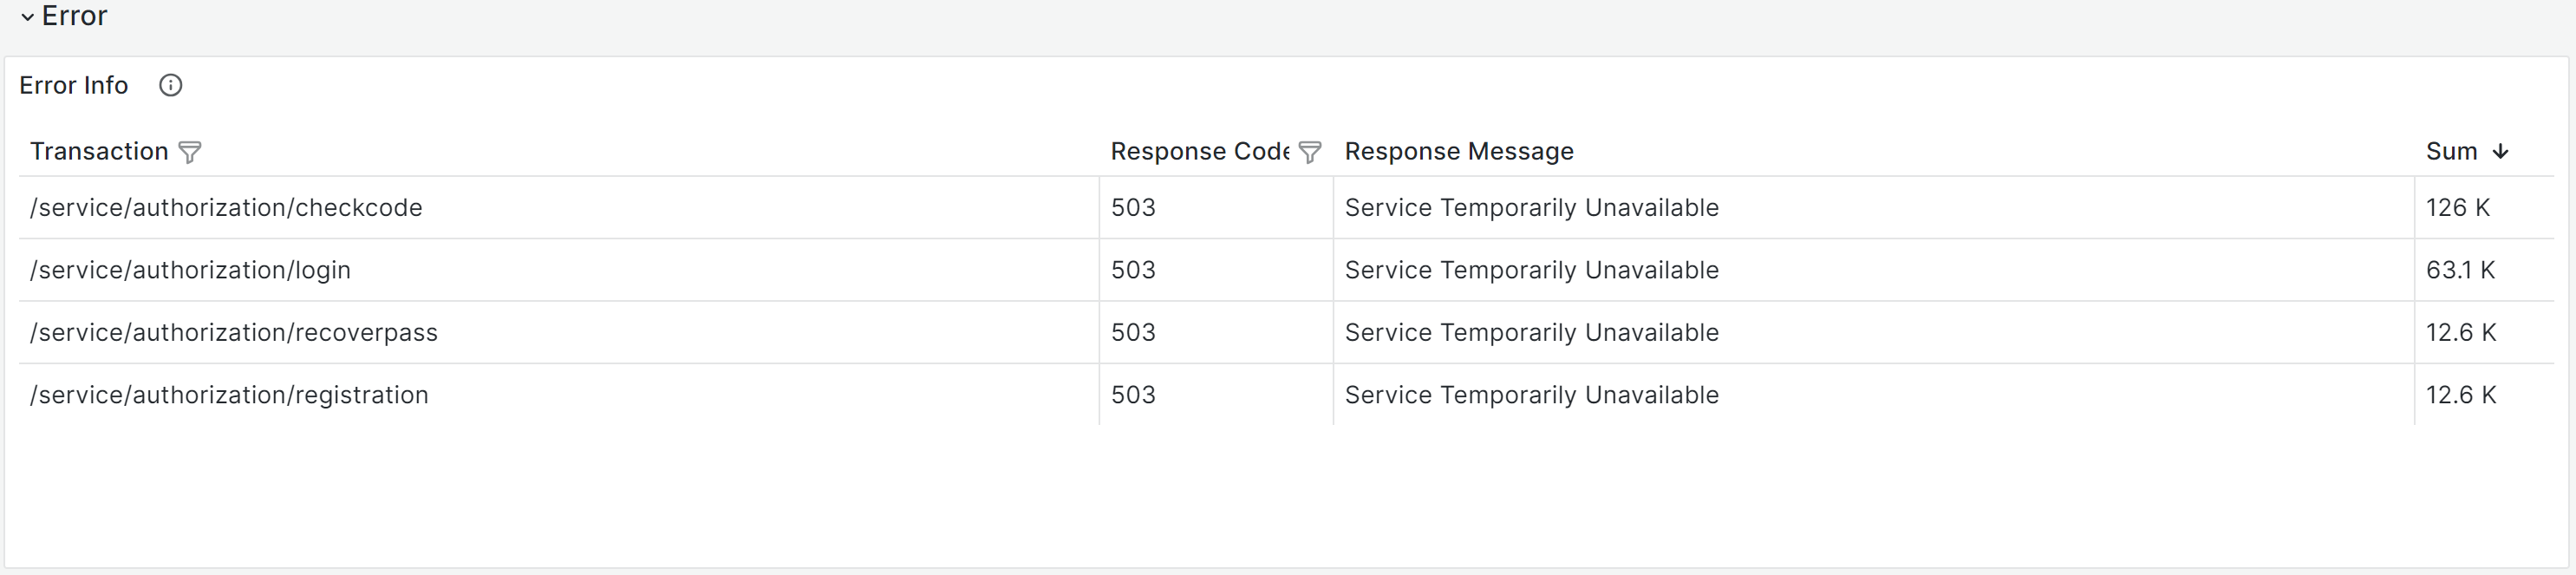
- Error - error information
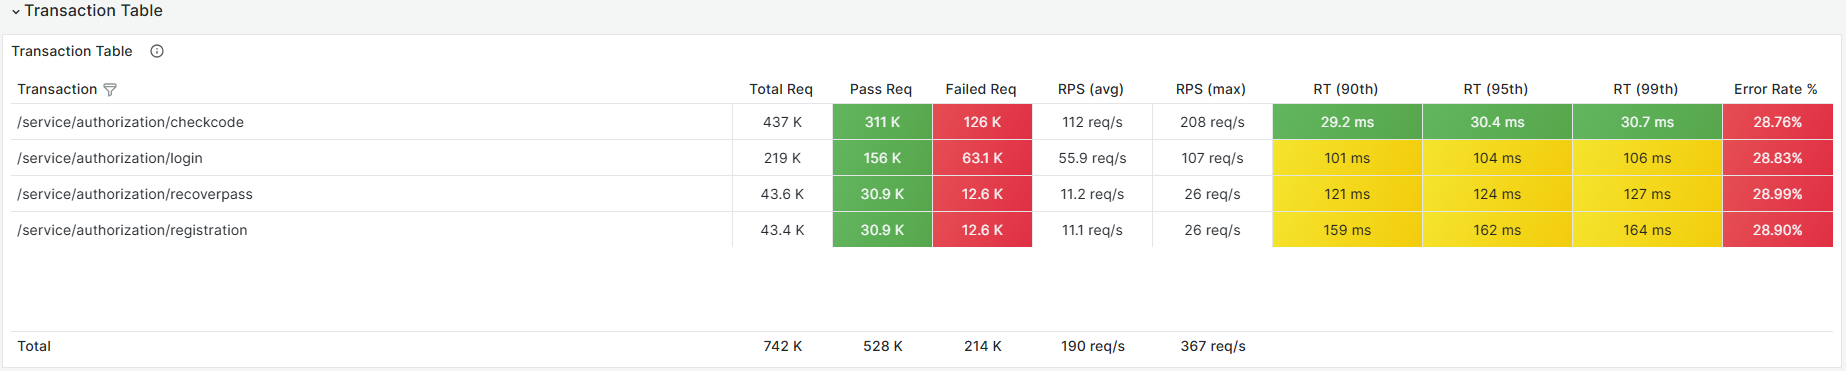
- Transaction Table - request / transaction statistics
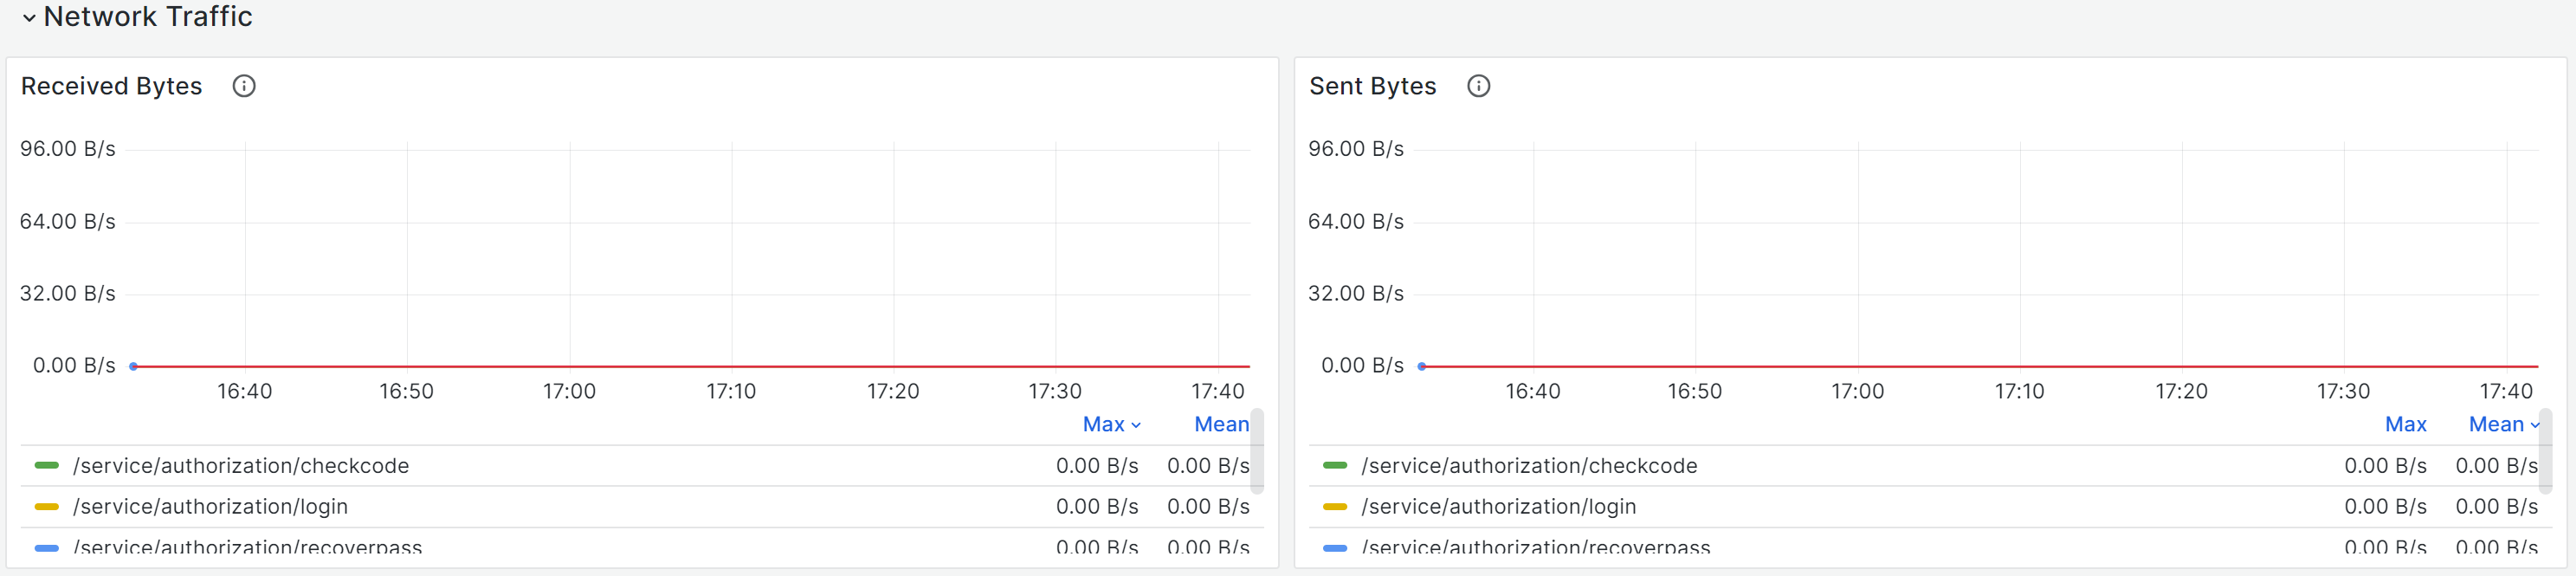
- Network Traffic - bytes received / bytes sent
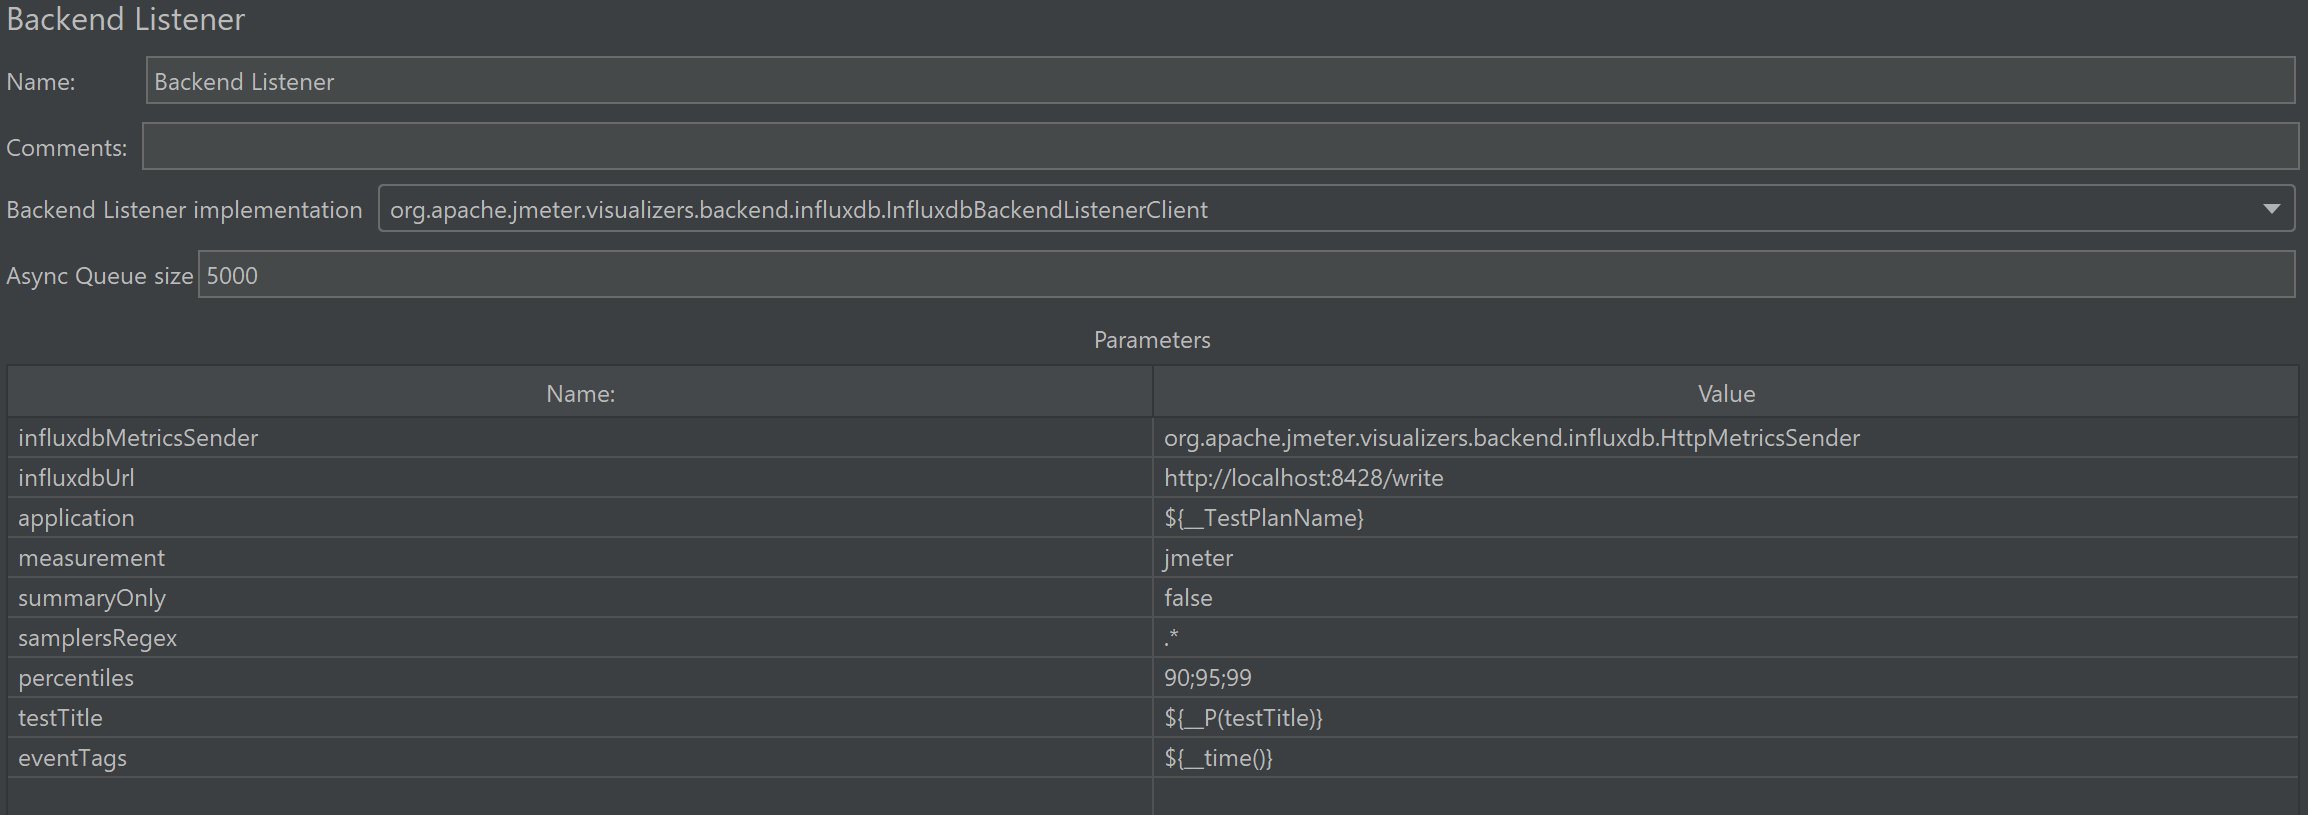
Before running the test for the first time, you need to change the Backend Listener:
- Backend Listener implementation = InfluxdbBackendListenerClient
- measurement = jmeter –> the parameter value is used as a prefix to the name of the metrics.
- application = ${__TestPlanName} –> name jmx-file
- testTitle = ${__P(testTitle)} –> test title (property is passed at startup)
- eventTags = ${__time()} –> unique RunID
Note: the metric events_text is being written incorrectly in VictoriaMetrics (testTitle и eventTags).
For more information, see Description of the script for Jmeter.
Data source config
Collector type:
Collector plugins:
Collector config:
Revisions
Upload an updated version of an exported dashboard.json file from Grafana
| Revision | Description | Created | |
|---|---|---|---|
| Download |