
Kestrel Metrics
Low-level performance metrics from ASP.NET Core Kestrel
Kestrel Connections Dashboard
This Grafana dashboard provides detailed monitoring and visualization of ASP.NET Core Kestrel web server performance metrics. It focuses on connection-level metrics that are crucial for understanding your web application's performance and behavior at the server level.
Source Code
View source for this dashboard here: https://github.com/petabridge/dotnet-grafana-dashboards/blob/master/kestrel/README.md
Dashboard Overview
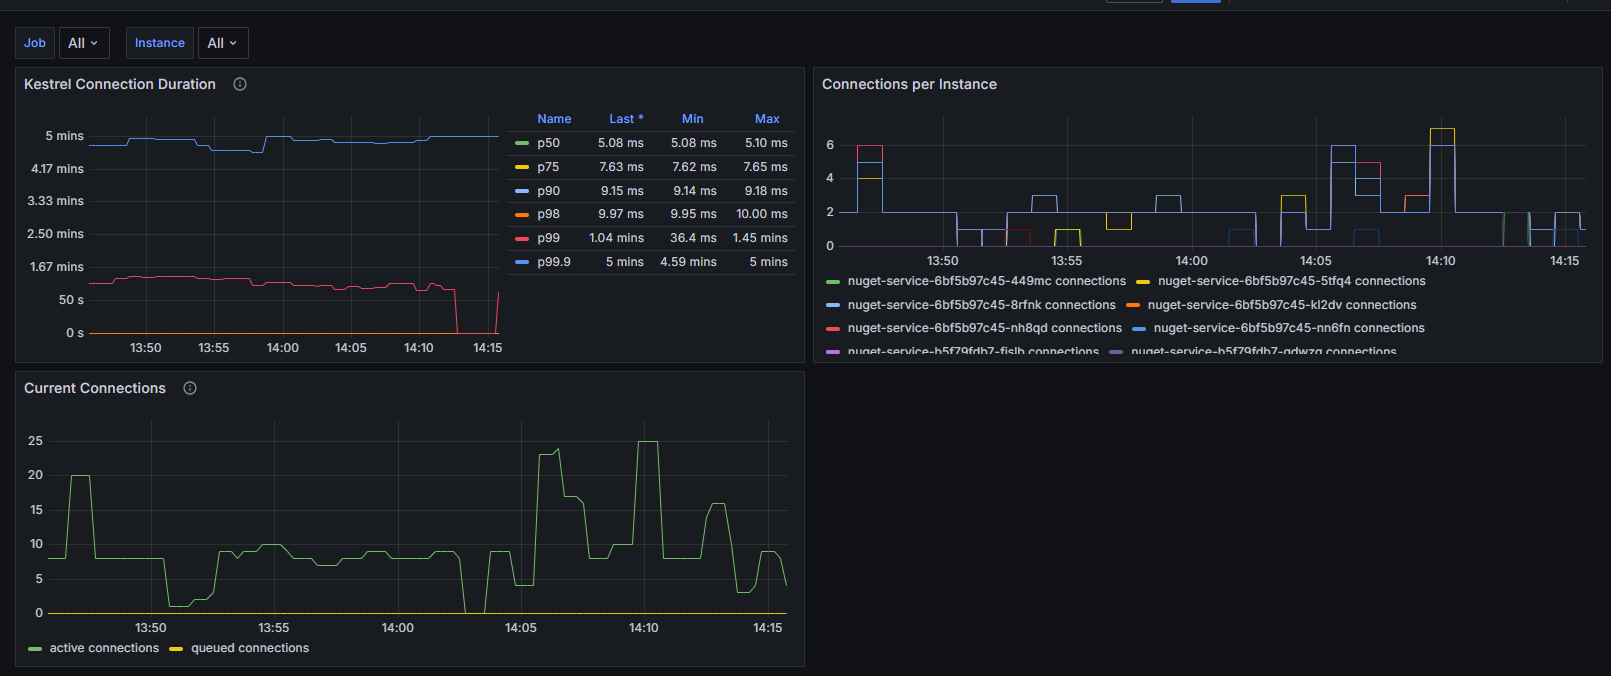
The dashboard includes metrics for:
- Connection duration percentiles (p50, p75, p90, p98, p99)
- Active and queued connections
- Connections per instance of each application
Prerequisites
To use this dashboard, you need to have the OpenTelemetry.Instrumentation.AspNetCore package installed in your .NET application:
<ItemGroup>
    <PackageReference Include="OpenTelemetry.Instrumentation.AspNetCore" Version="{version}" />
</ItemGroup>
This dashboard is designed to work with Prometheus and the OTLP Exporter.
var builder = WebApplication.CreateBuilder(args);
builder.Services.AddOpenTelemetry()
.WithMetrics(metrics =>
{
metrics
// OTHER METRICS SOURCES
.AddAspNetCoreInstrumentation();
})
// traces, et al
.UseOtlpExporter();
var app = builder.Build();
Installation
Import the dashboard into Grafana from Grafana Cloud:
Import the dashboard into Grafana as a JSON file:
- Open Grafana
- Navigate to Dashboards > Import
- Click "Upload JSON file"
- Select the
kestrel-connections-dashboard.jsonfile - Select your Prometheus data source
- Click "Import"
Metrics Explanation
- Connection Duration: Shows how long Kestrel connections stay open, broken down by percentiles
- Active Connections: Real-time count of current open connections
- Connection Rate: Number of new connections per second
- Queue Length: Number of connections waiting to be processed
Data source config
Collector config:
Upload an updated version of an exported dashboard.json file from Grafana
| Revision | Description | Created | |
|---|---|---|---|
| Download |