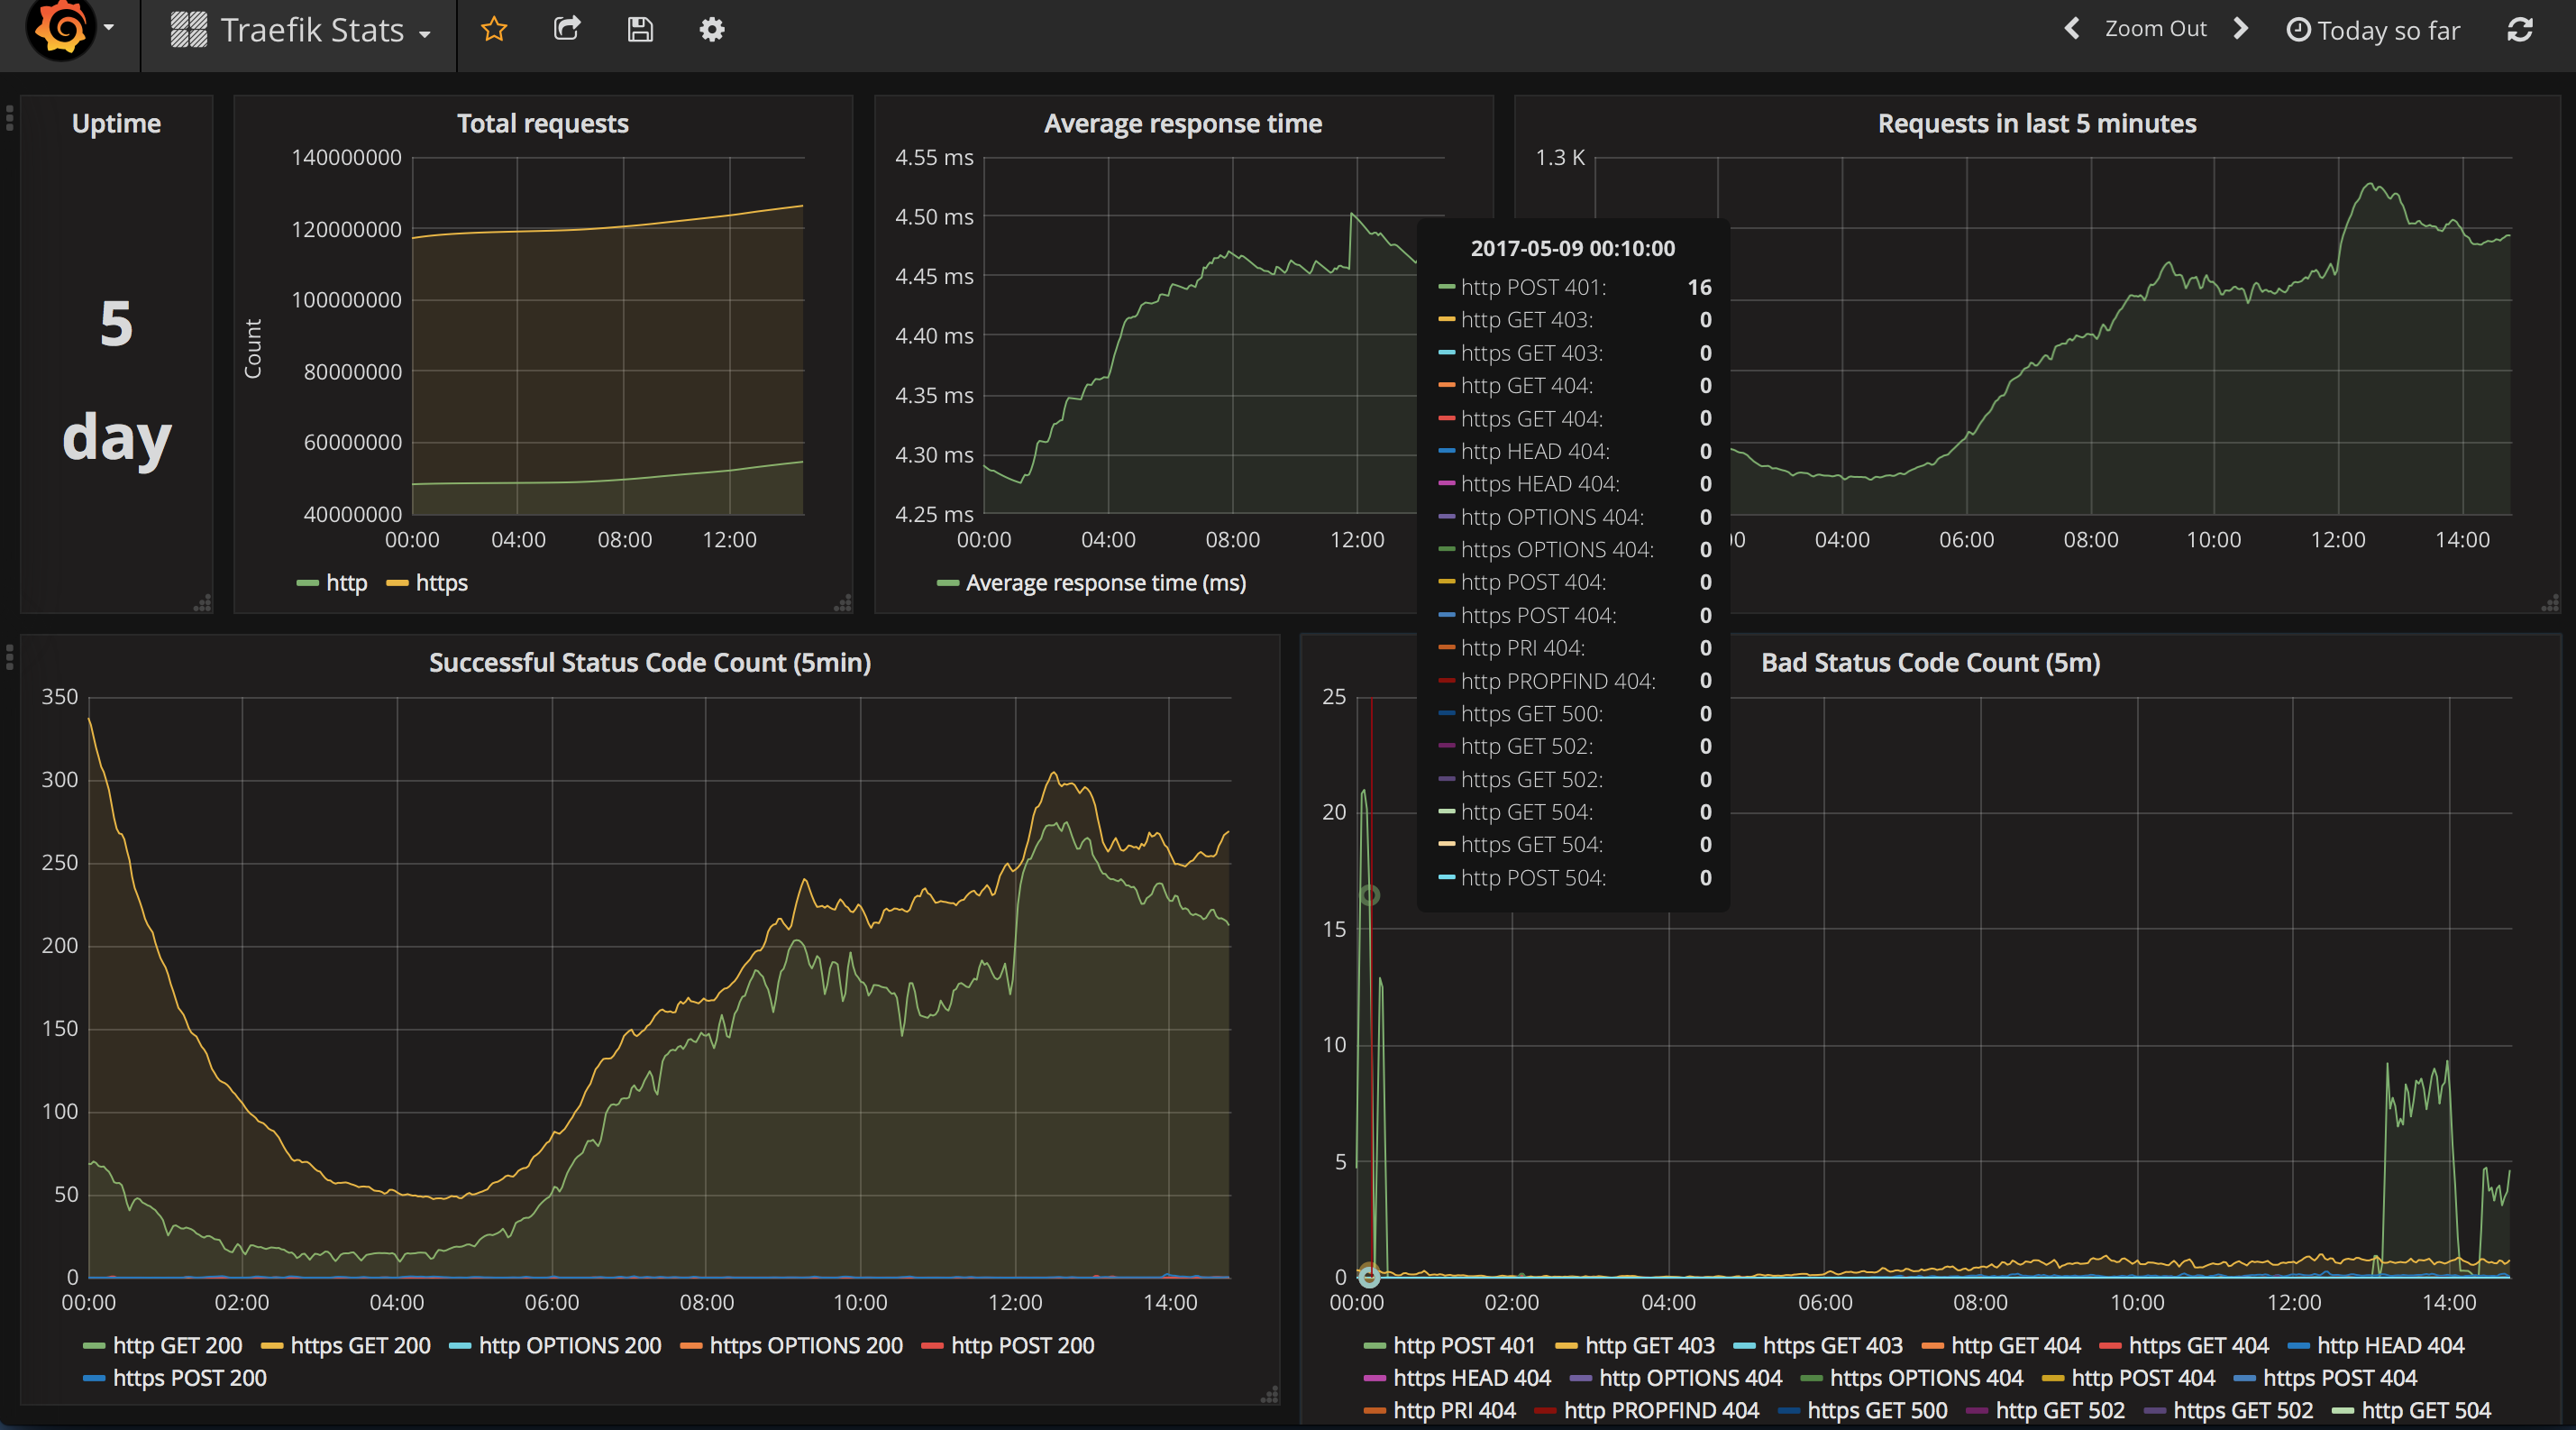
Traefik Realtime Stats
Visualize Traefik Health Metrics
- First, you would need to start your traefik instance with these parameters:
traefik --web.metrics --web.metrics.prometheus - Then you would need to make Prometheus aware of this endpoint. Since I run traefik in a Docker Swarm, I used it's DNS capabilities to discover my traefik instance launched as a service called "load-balancer".
(Please note the dashboard relies on it to get some stats, so you may need to edit the JSON if your service name is different)
Here is the Prometheus config snippet I use (8080 is the web port traefik is listening, can be configured by adding --web.address=:8080 to traefik):
- job_name: 'load-balancer'
    dns_sd_configs:
    - names:
      - 'tasks.load-balancer'
      type: 'A'
      port: 8080
Data source config
Collector type:
Collector plugins:
Collector config:
Revisions
Upload an updated version of an exported dashboard.json file from Grafana
| Revision | Description | Created | |
|---|---|---|---|
| Download |
Traefik
Easily monitor Traefik, the dynamic load balancer, with Grafana Cloud's out-of-the-box monitoring solution.
Learn more