
Story Dashboard by Cumulo v3
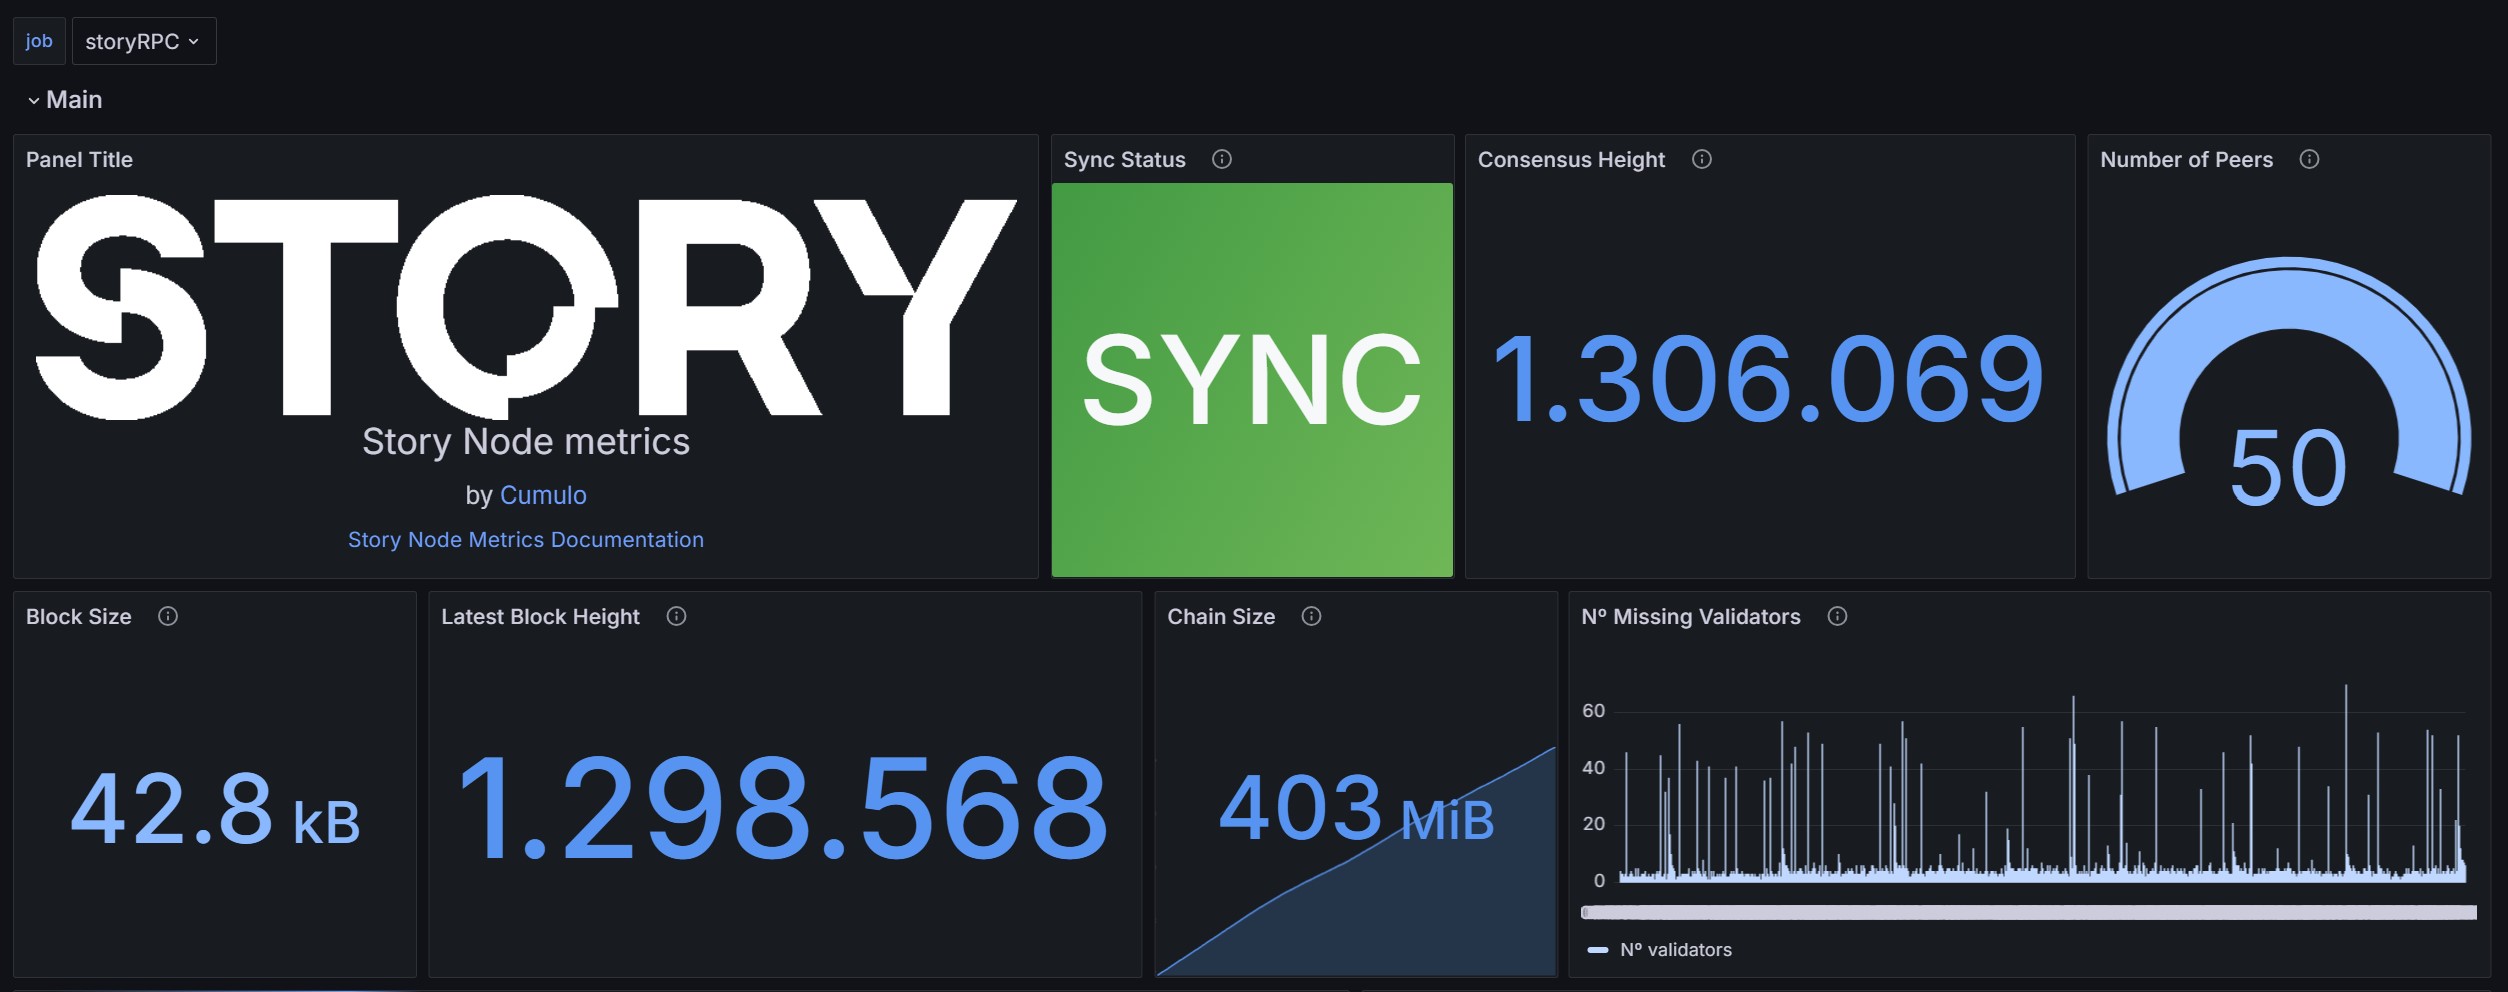
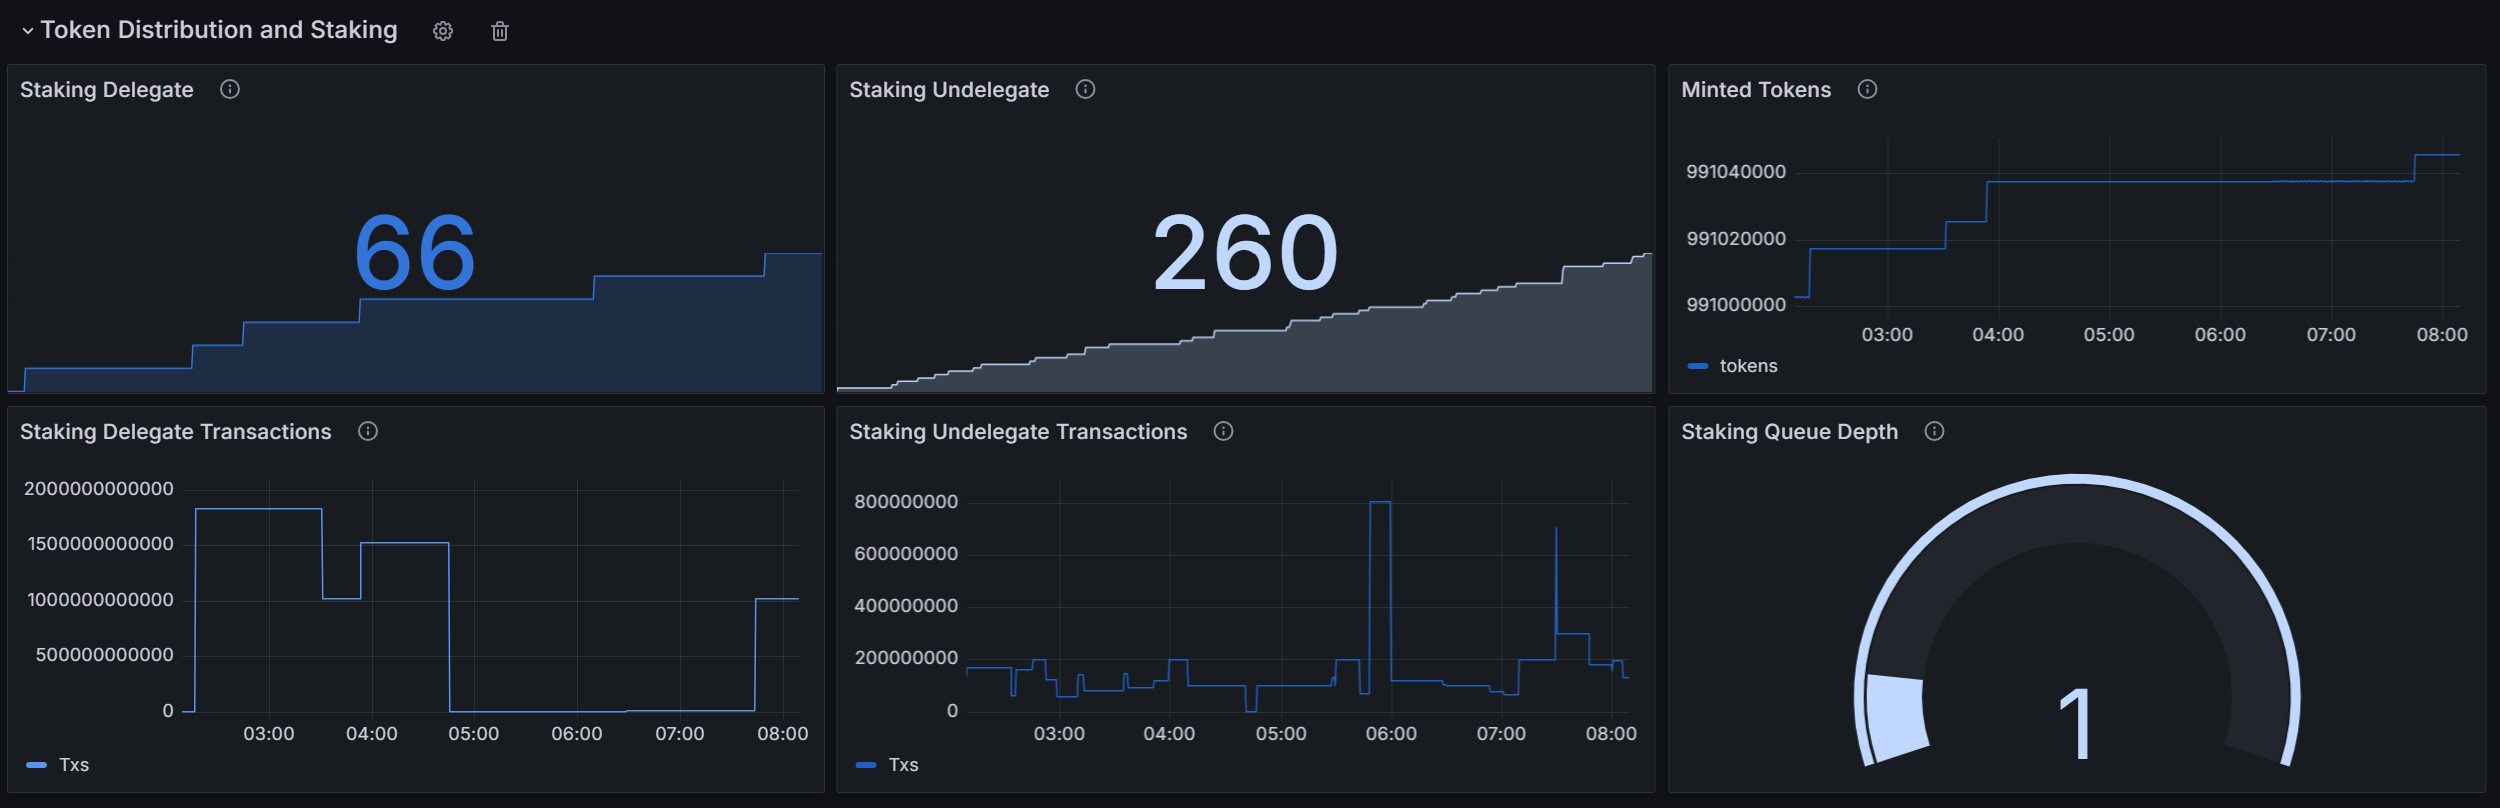
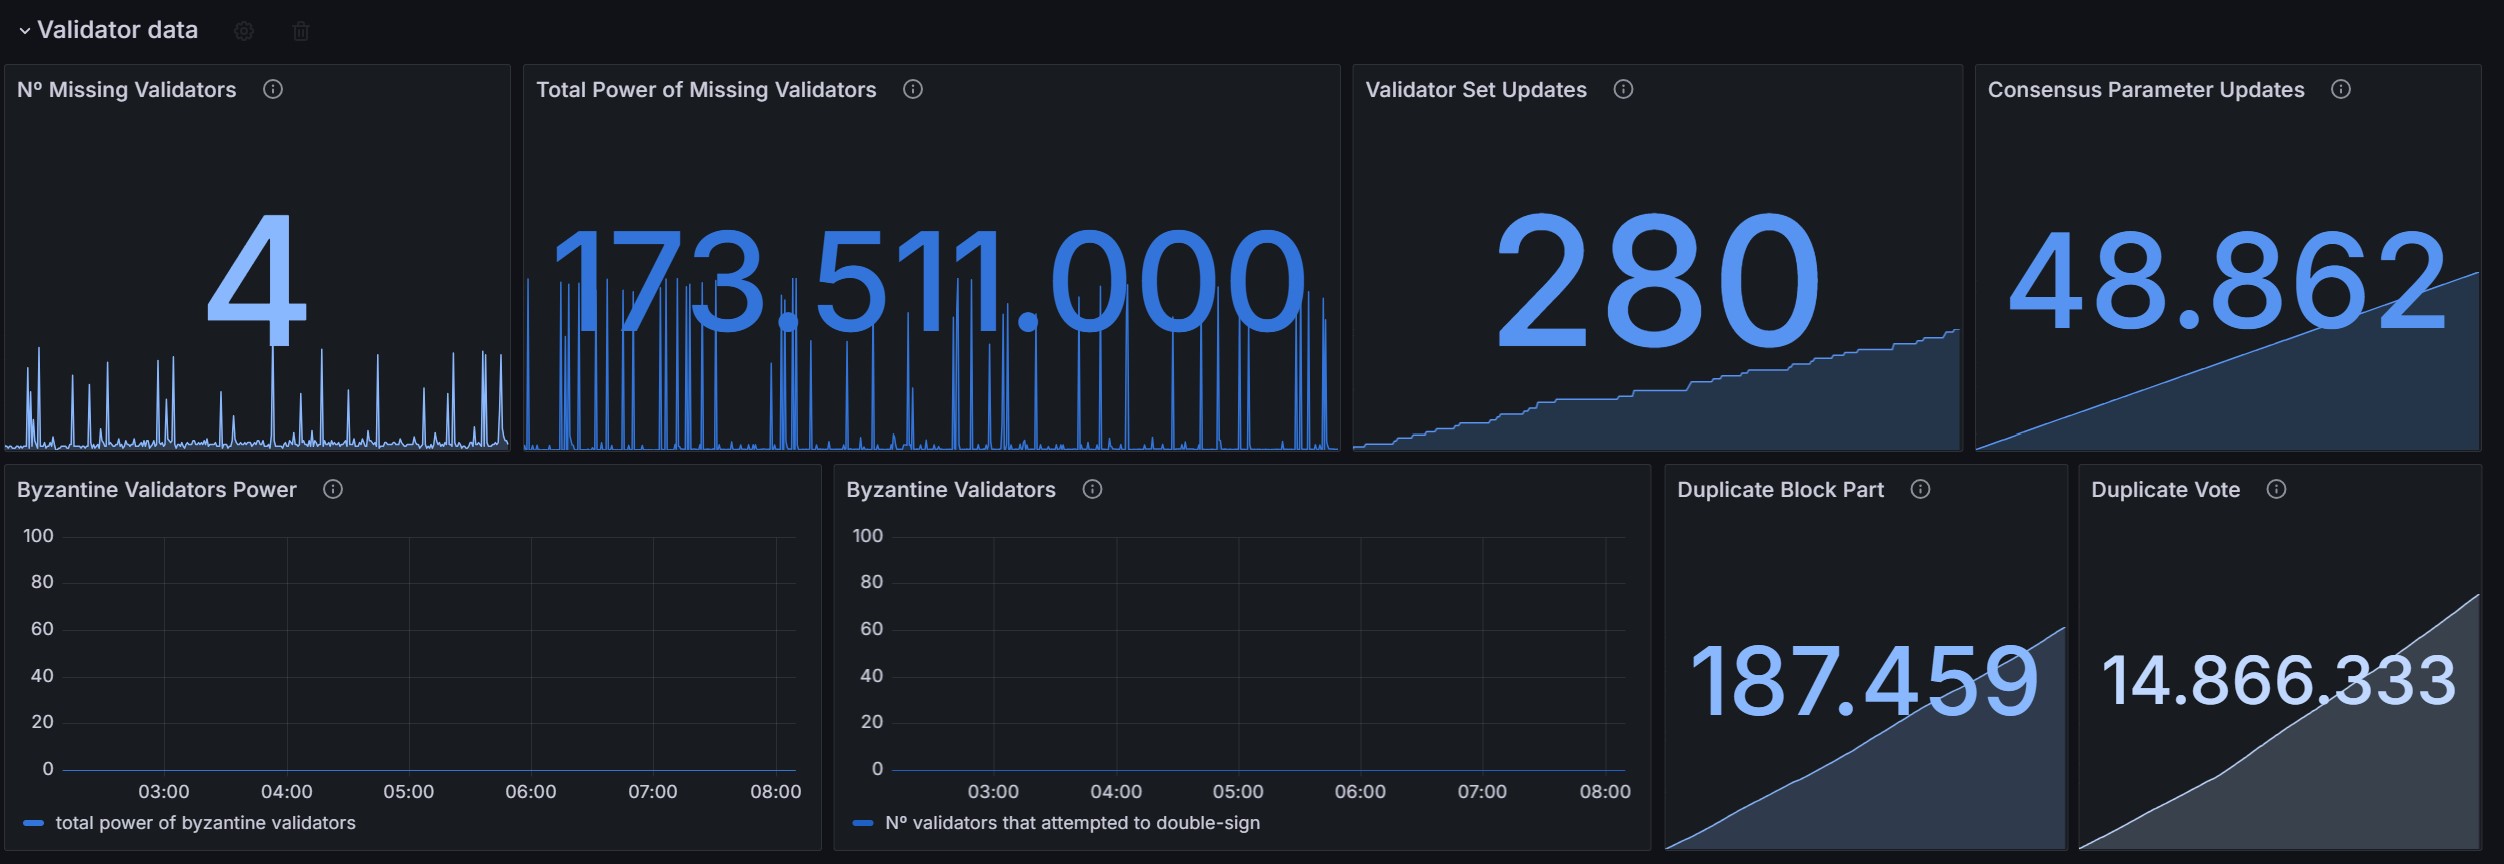
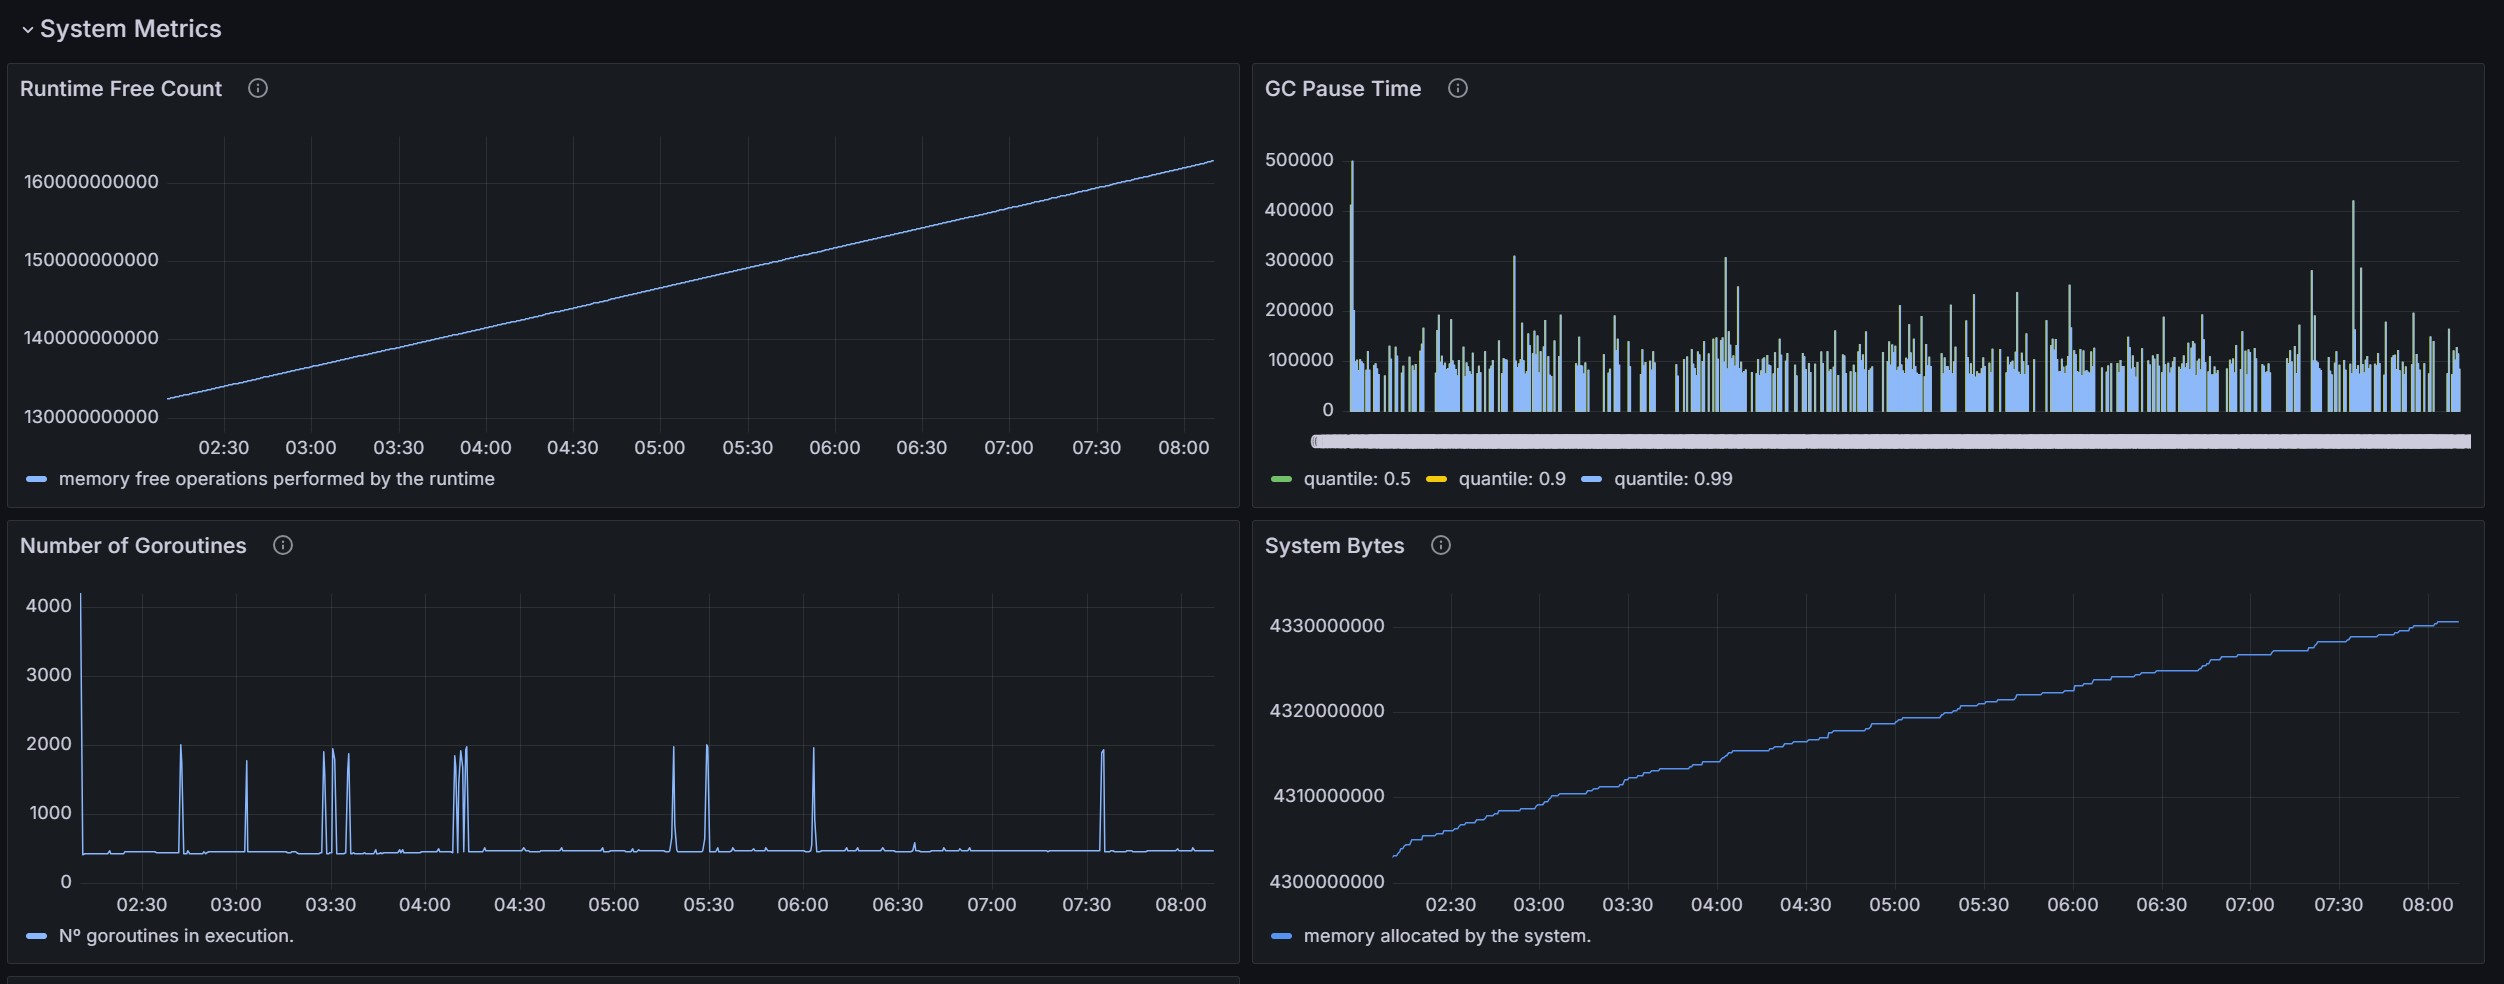
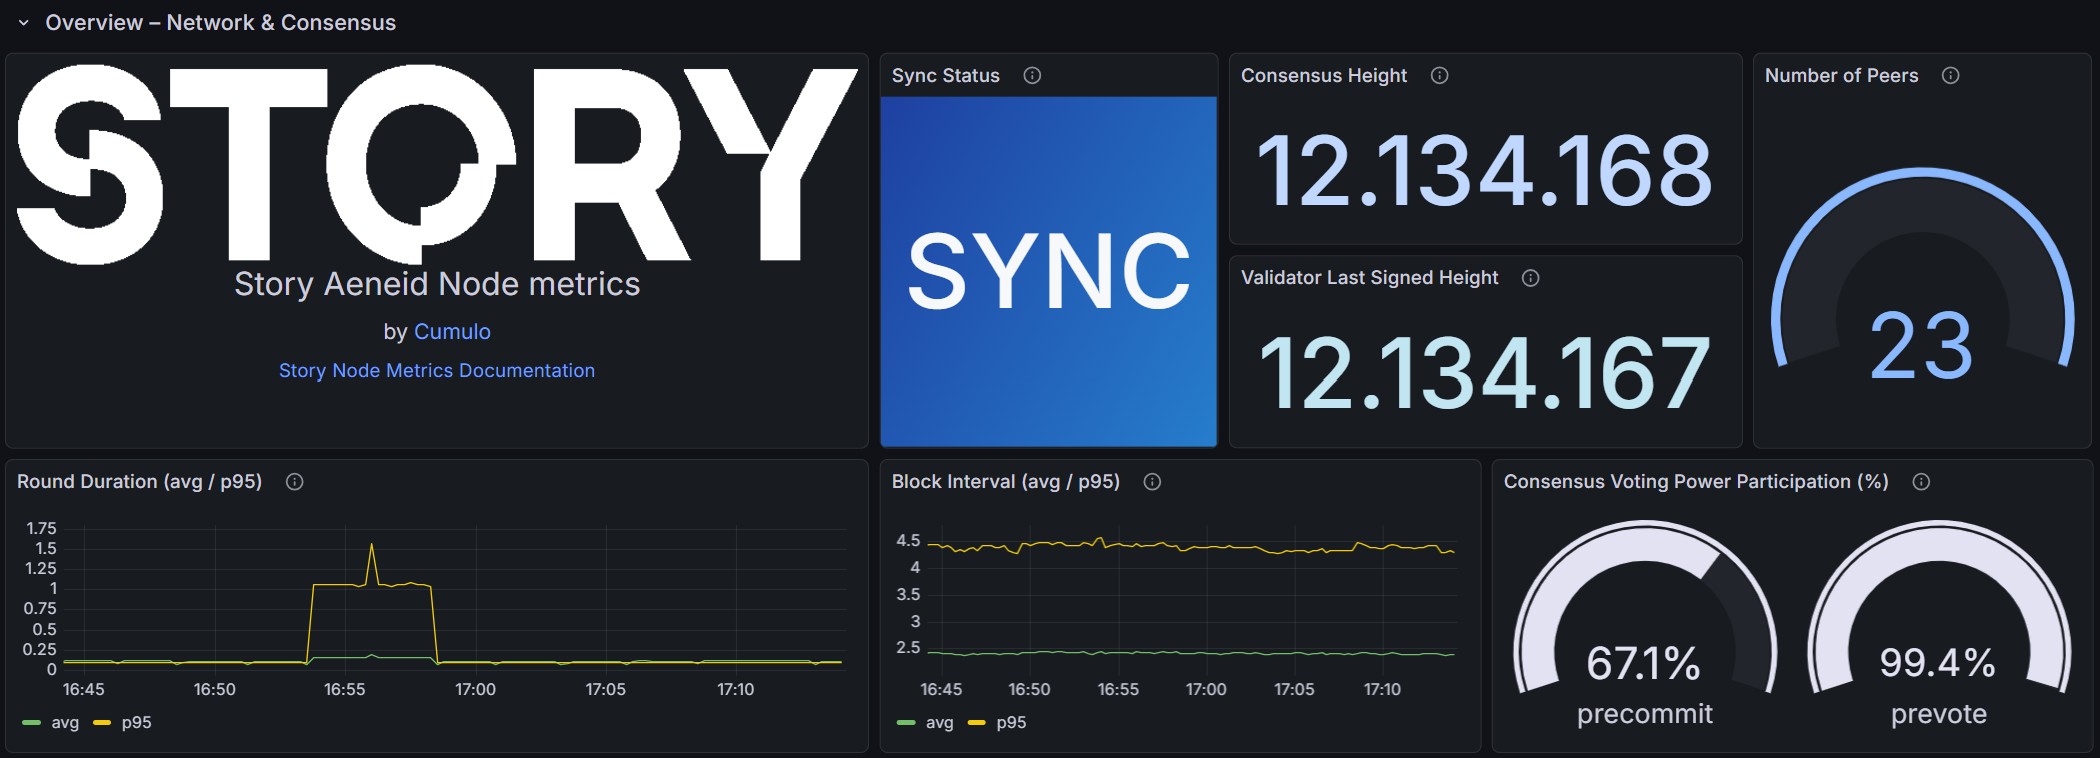
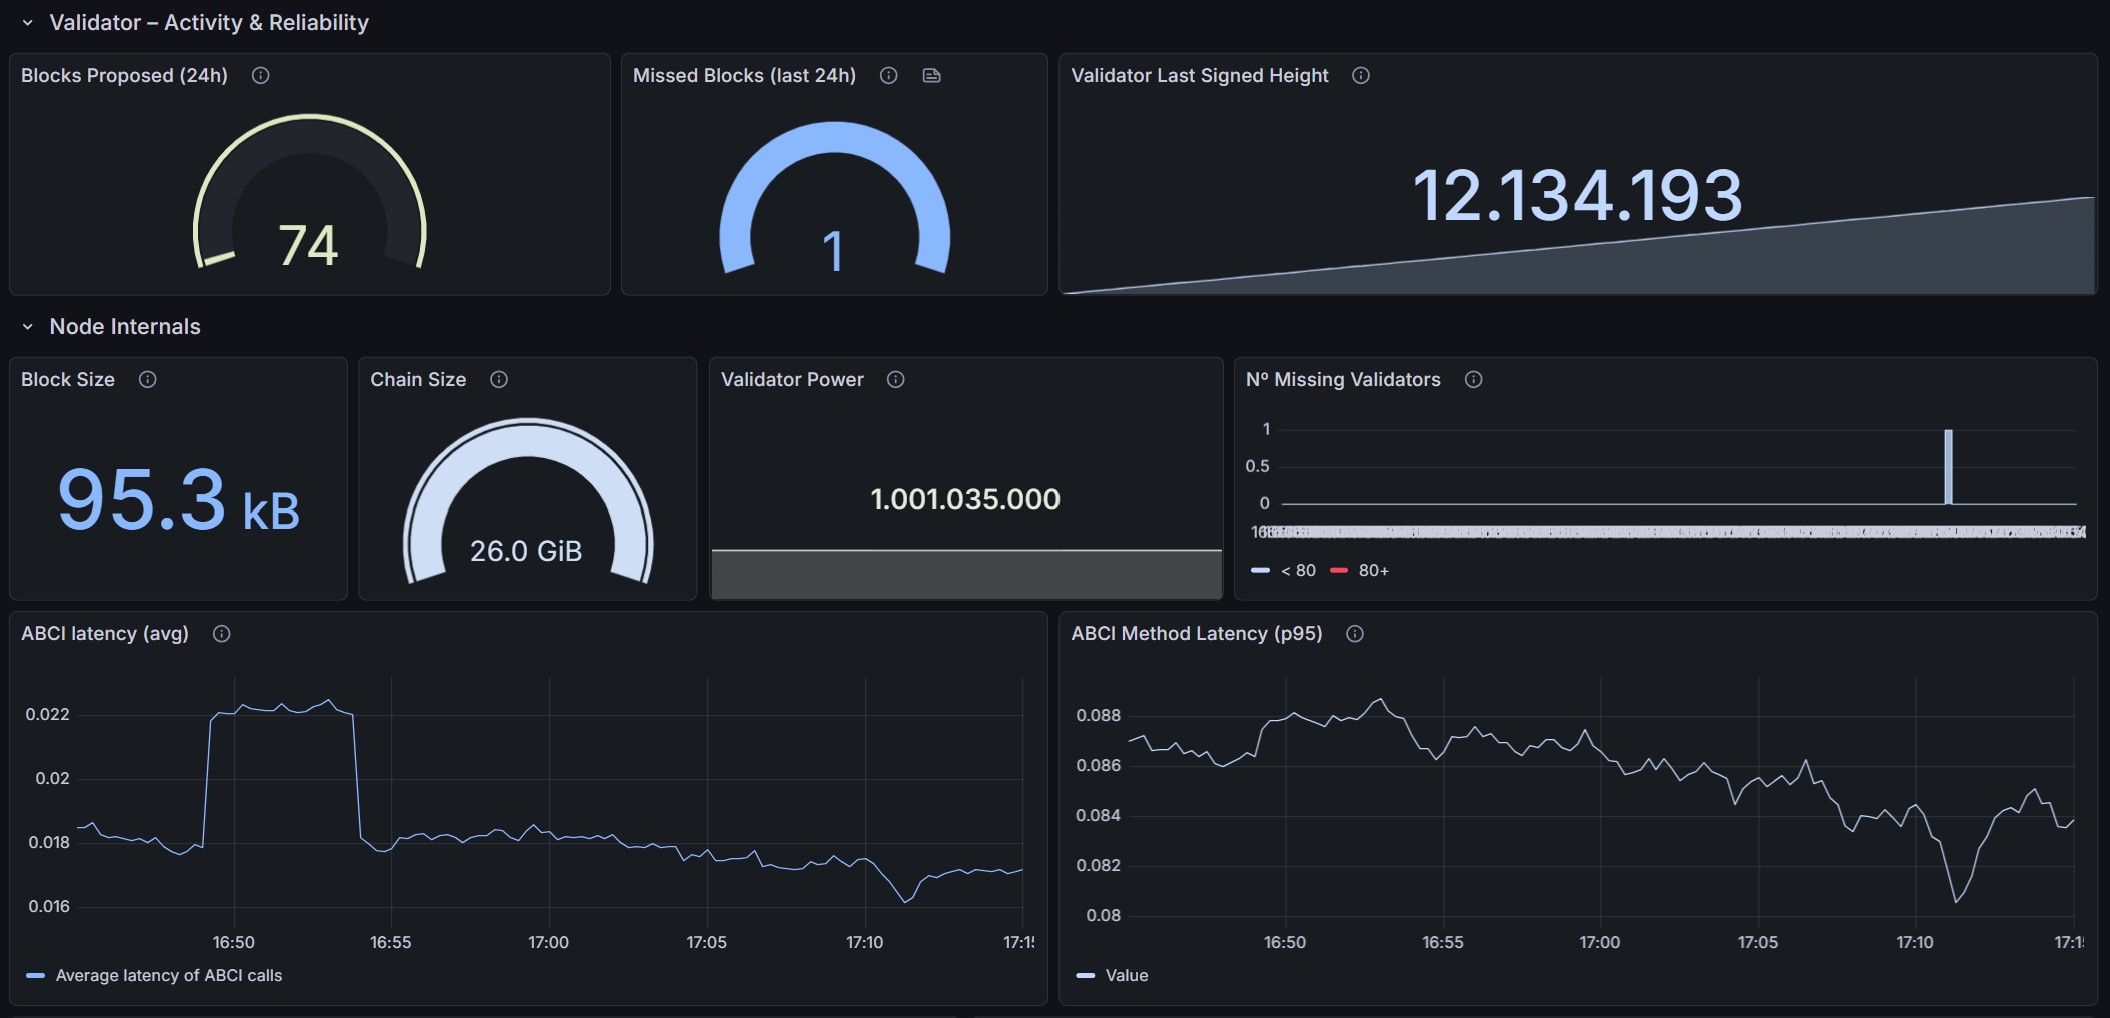
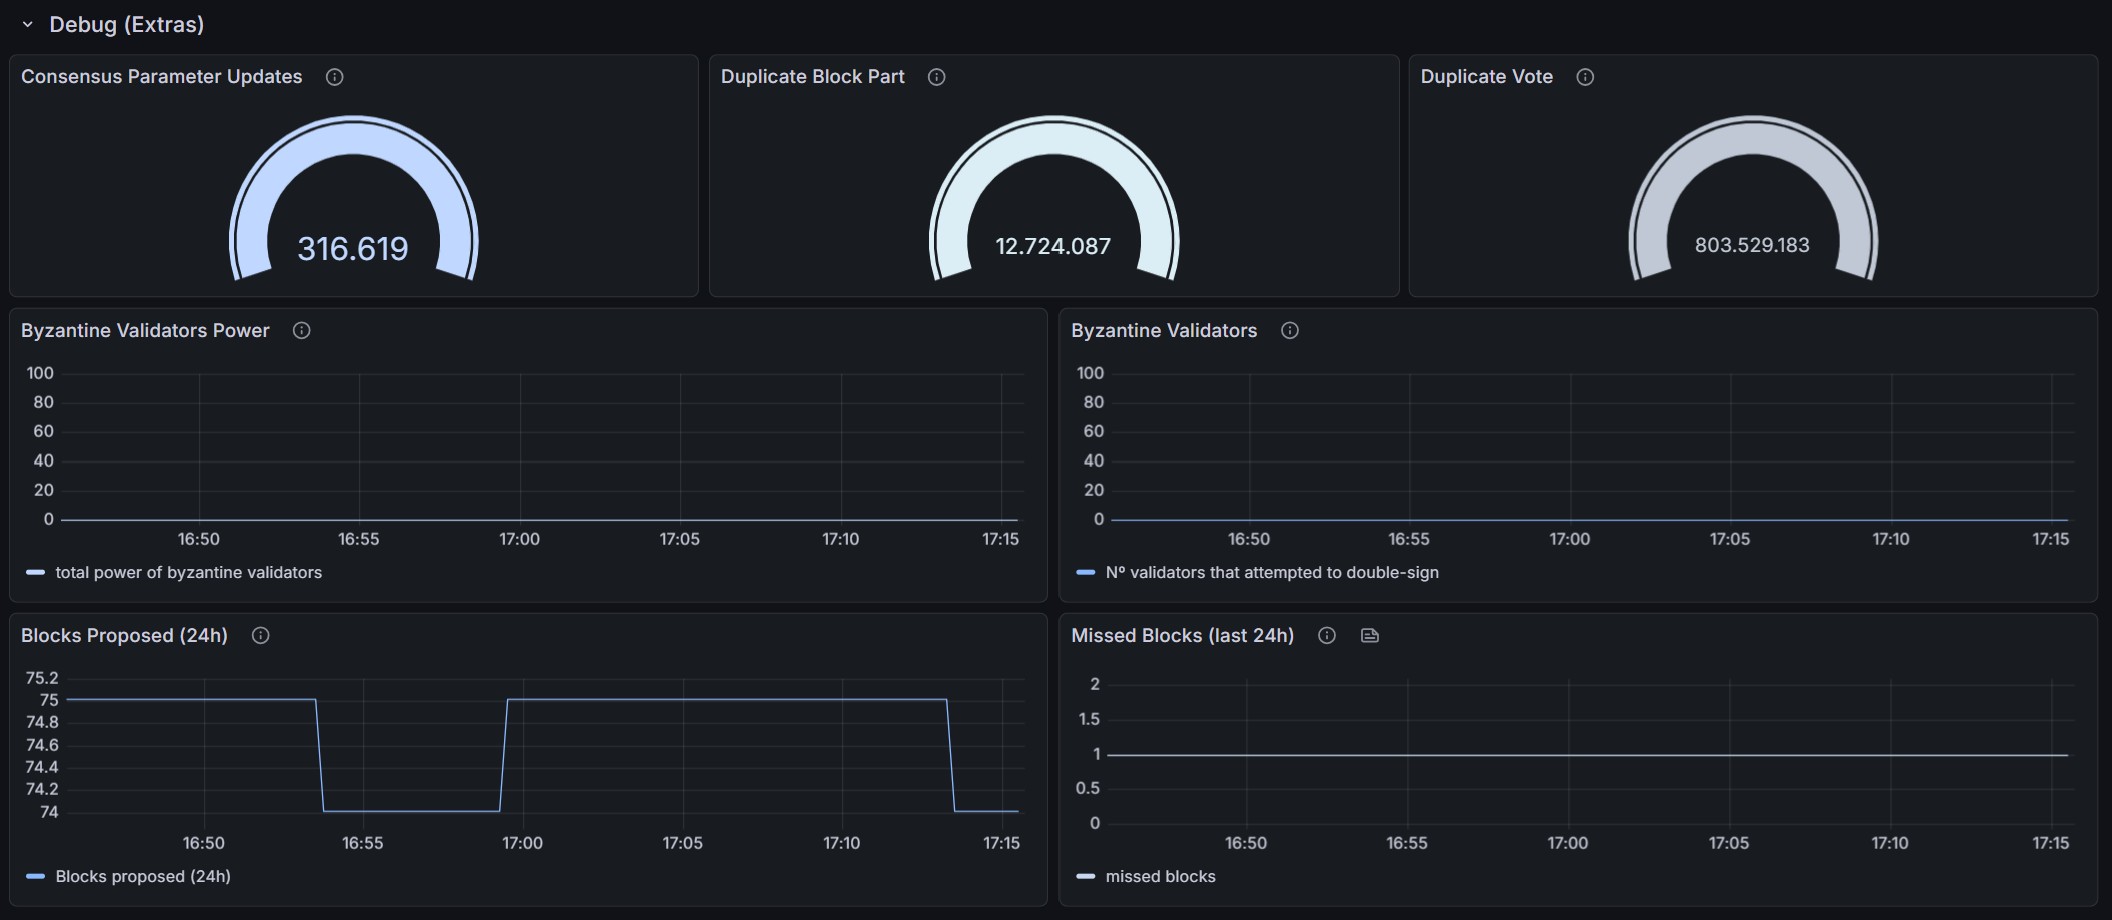
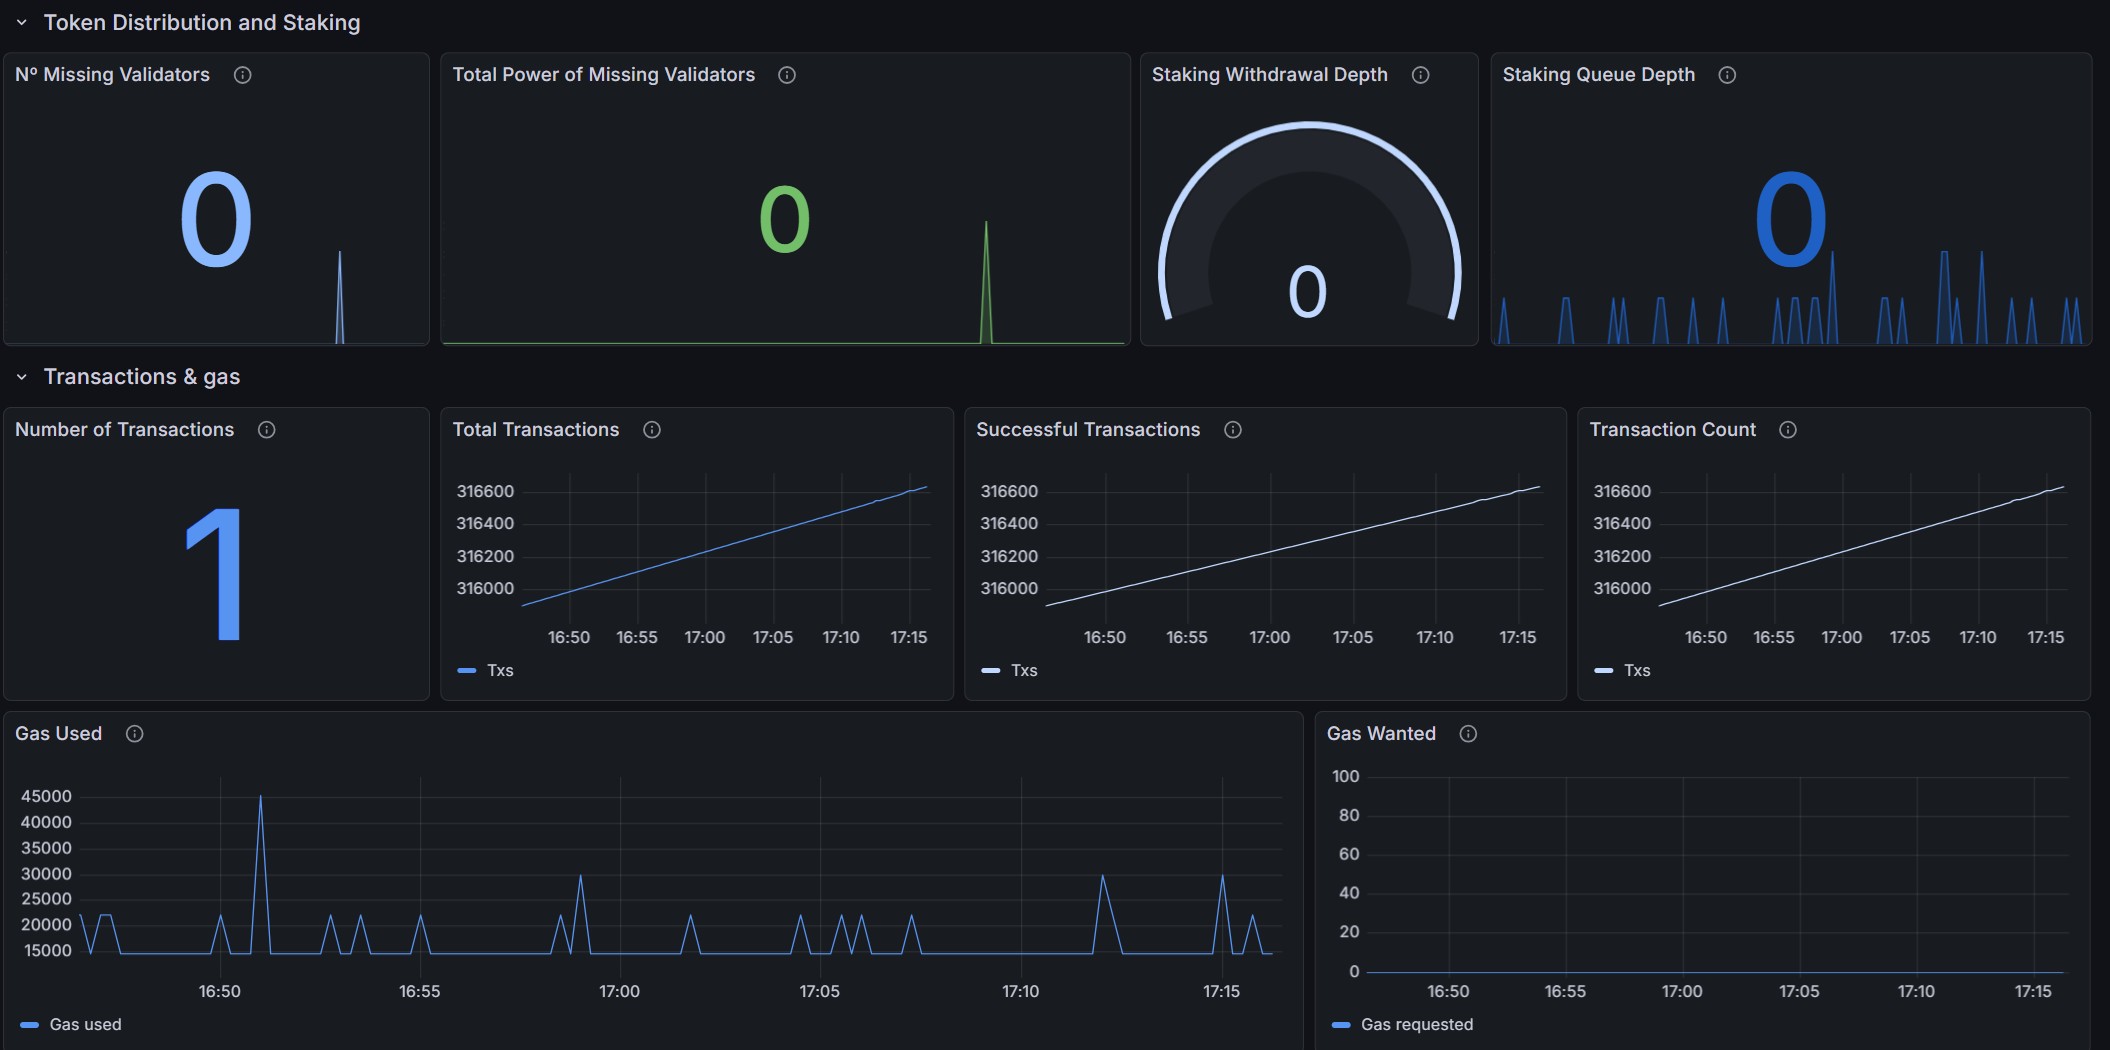
This dashboard provides an operational overview of the health, performance, and consensus behavior of a Story Aeneid node. It is designed for node operators and validators to monitor synchronization status, block production cadence, consensus efficiency, validator participation, transaction activity, and system resource usage in real time. The dashboard places a strong focus on consensus health (round durations, block intervals, voting power participation, missed blocks), allowing early detection of network issues, degraded validator performance, or abnormal consensus behavior. In addition, it exposes key runtime and system metrics to help identify performance bottlenecks, resource pressure, and memory or garbage collection inefficiencies at the node level. Together, these metrics provide actionable insights to maintain a stable, performant, and well-behaved Story node in both normal operation and incident scenarios. For detailed metric definitions and PromQL references, see: Story Node Metrics Documentation https://github.com/Cumulo-pro/Story_protocol/blob/main/monitoring/story_aeneid_metrics.md
Data source config
Collector config:
Upload an updated version of an exported dashboard.json file from Grafana
| Revision | Description | Created | |
|---|---|---|---|
| Download |