
Application Gateway / Container / Metrics
How to activate this dashboard? Welcome to the Azure Application for Container Grafana Dashboard. Learn more about dashboard. Choose your resource group and related workspace that sources AGCAccessLogs.
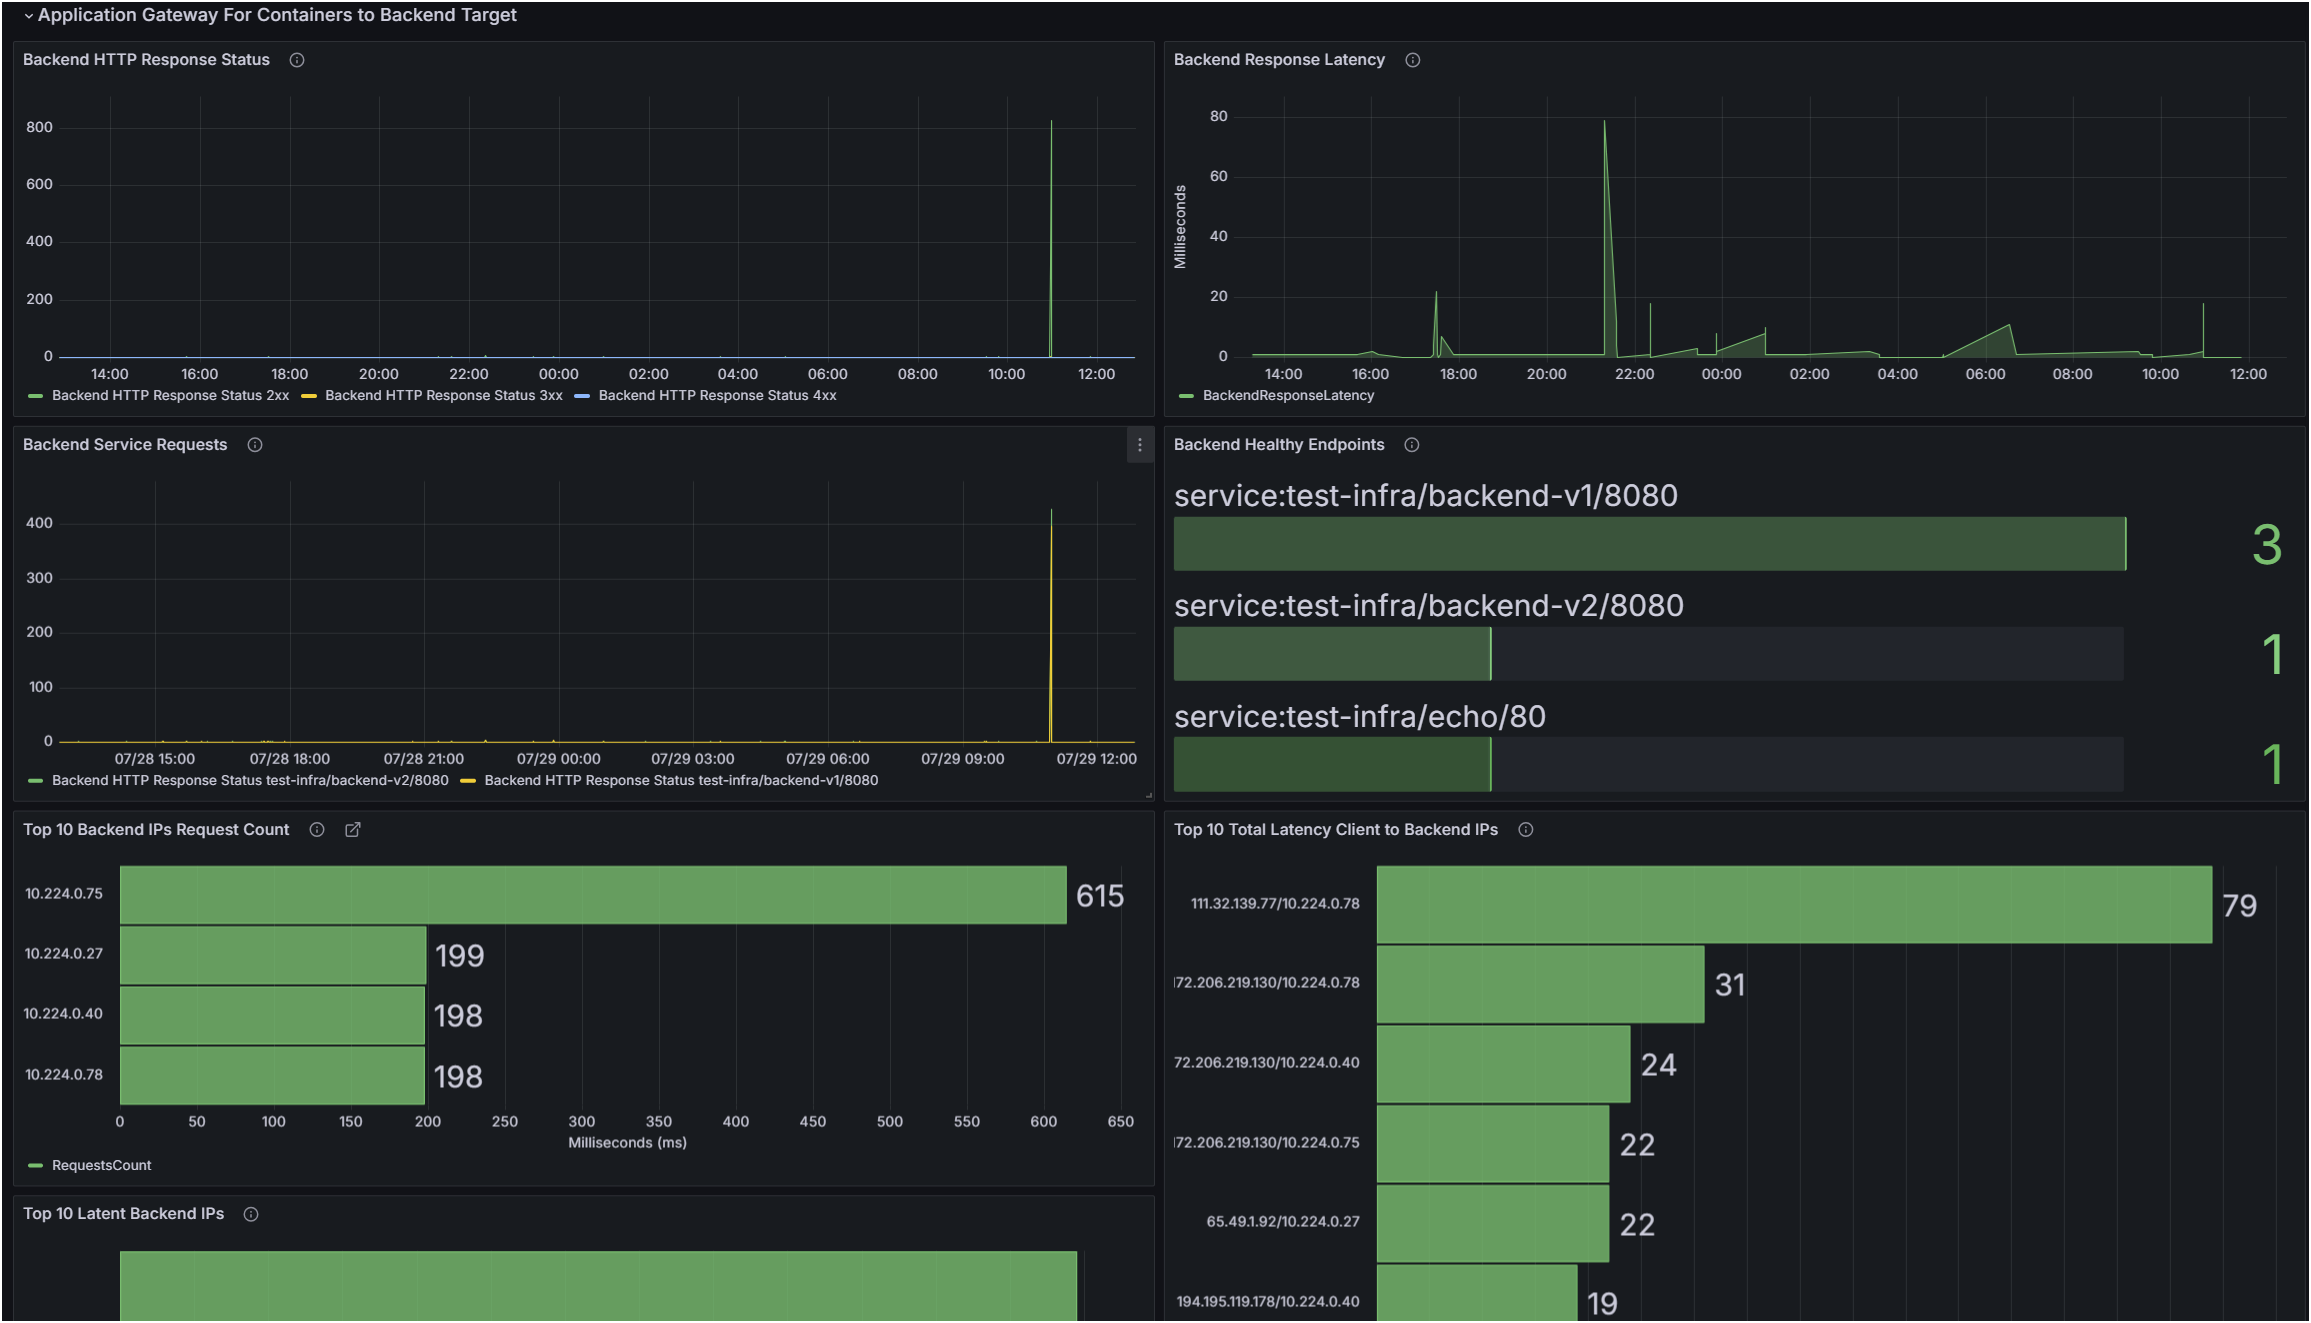
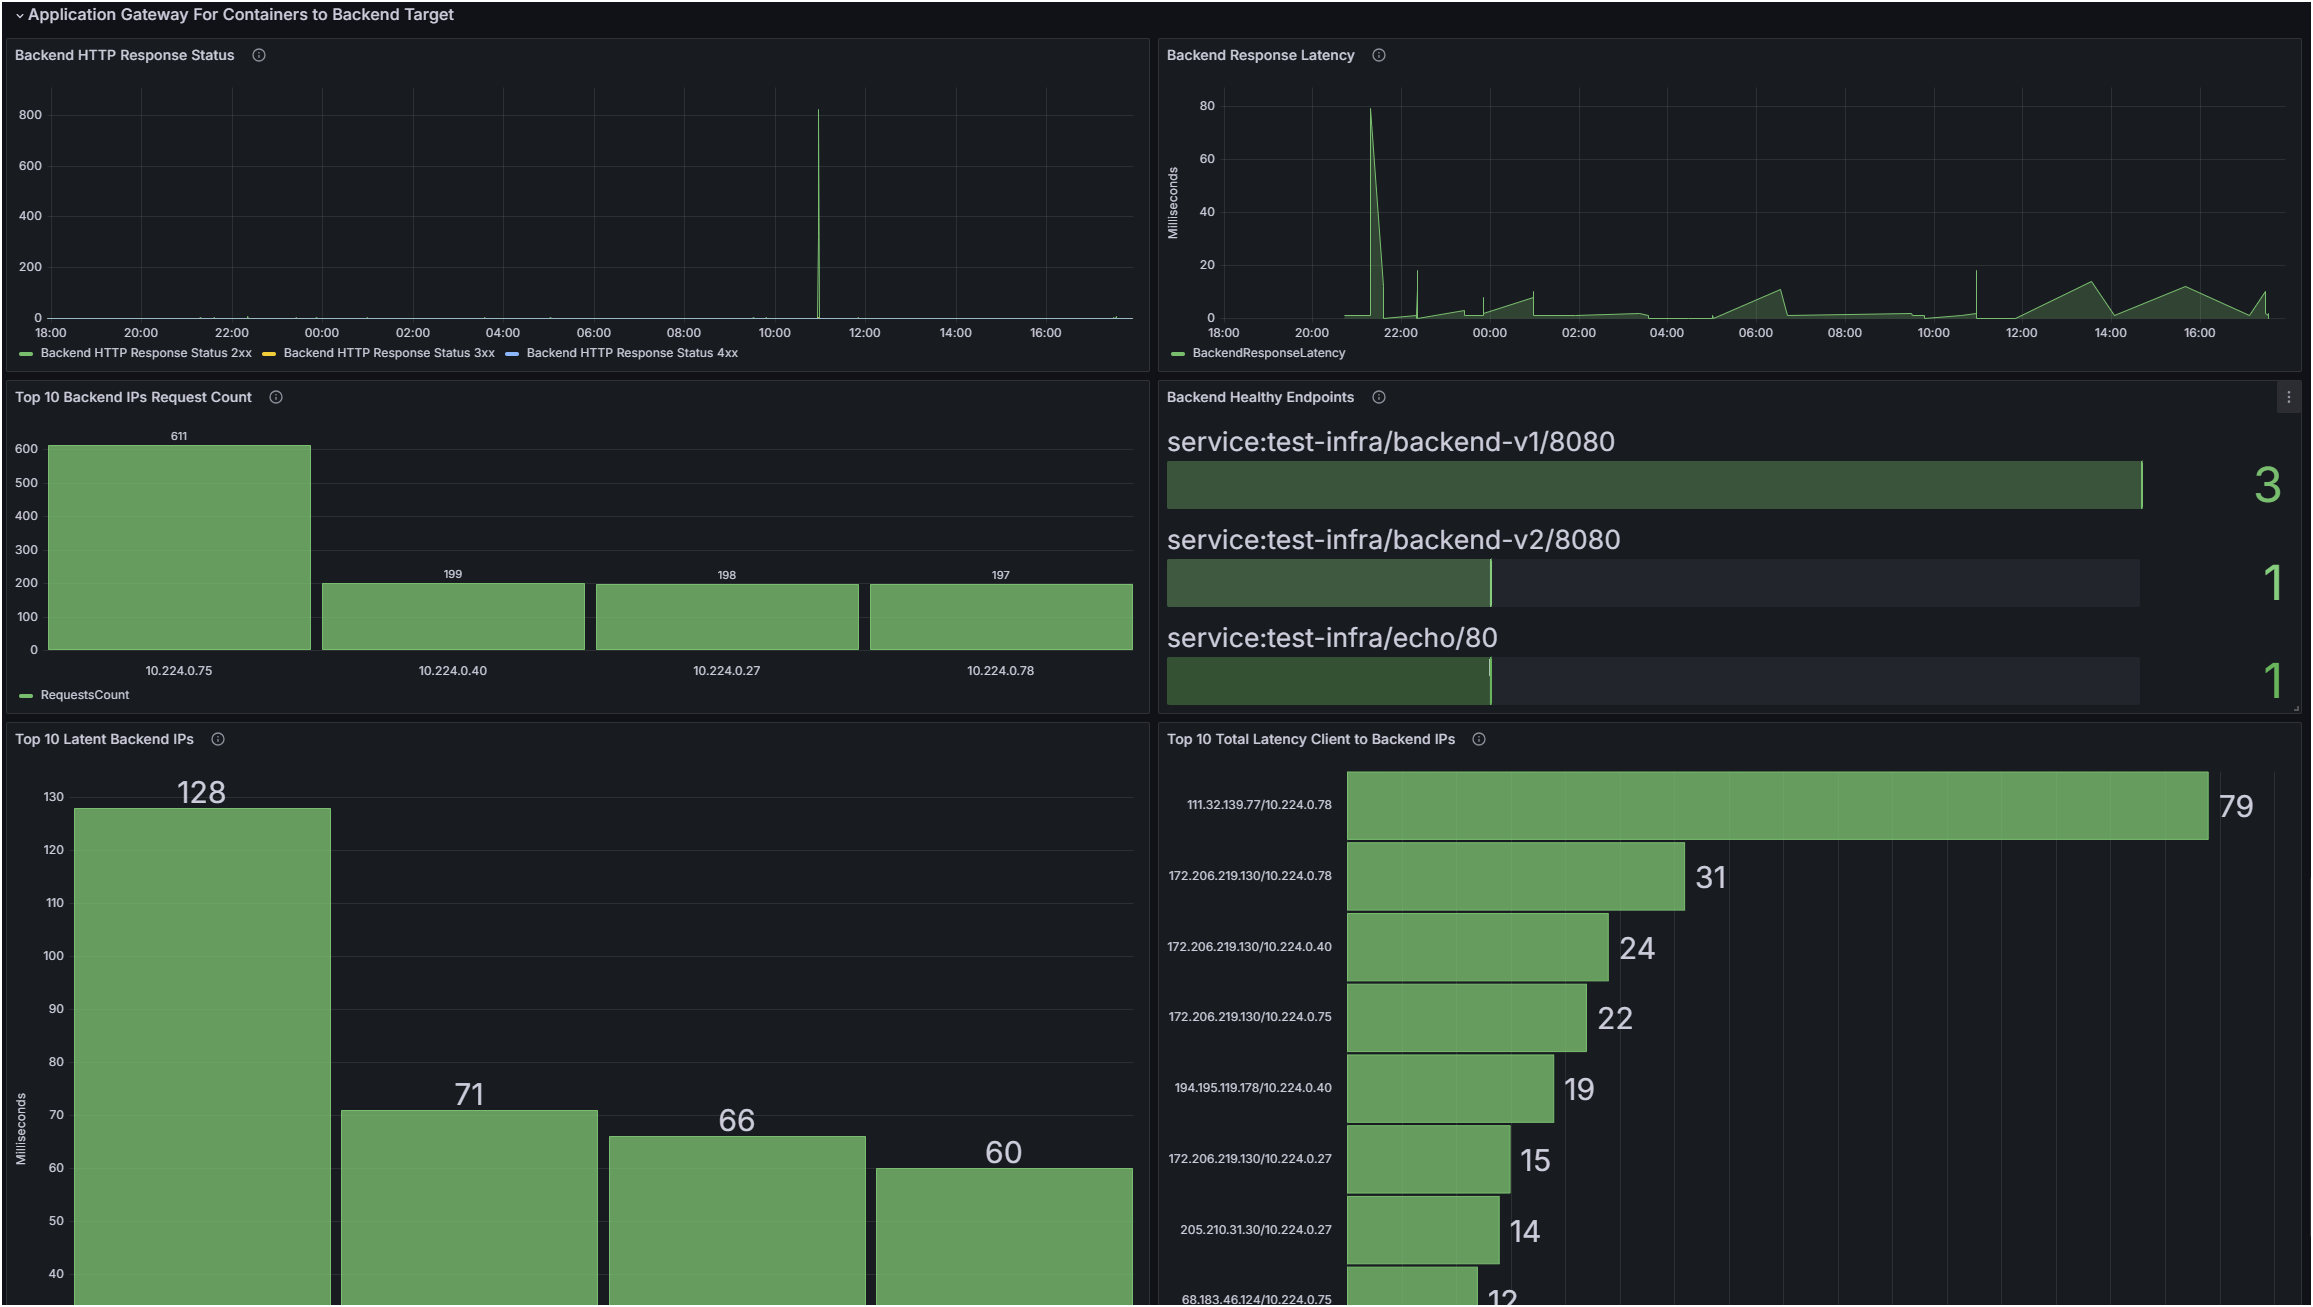
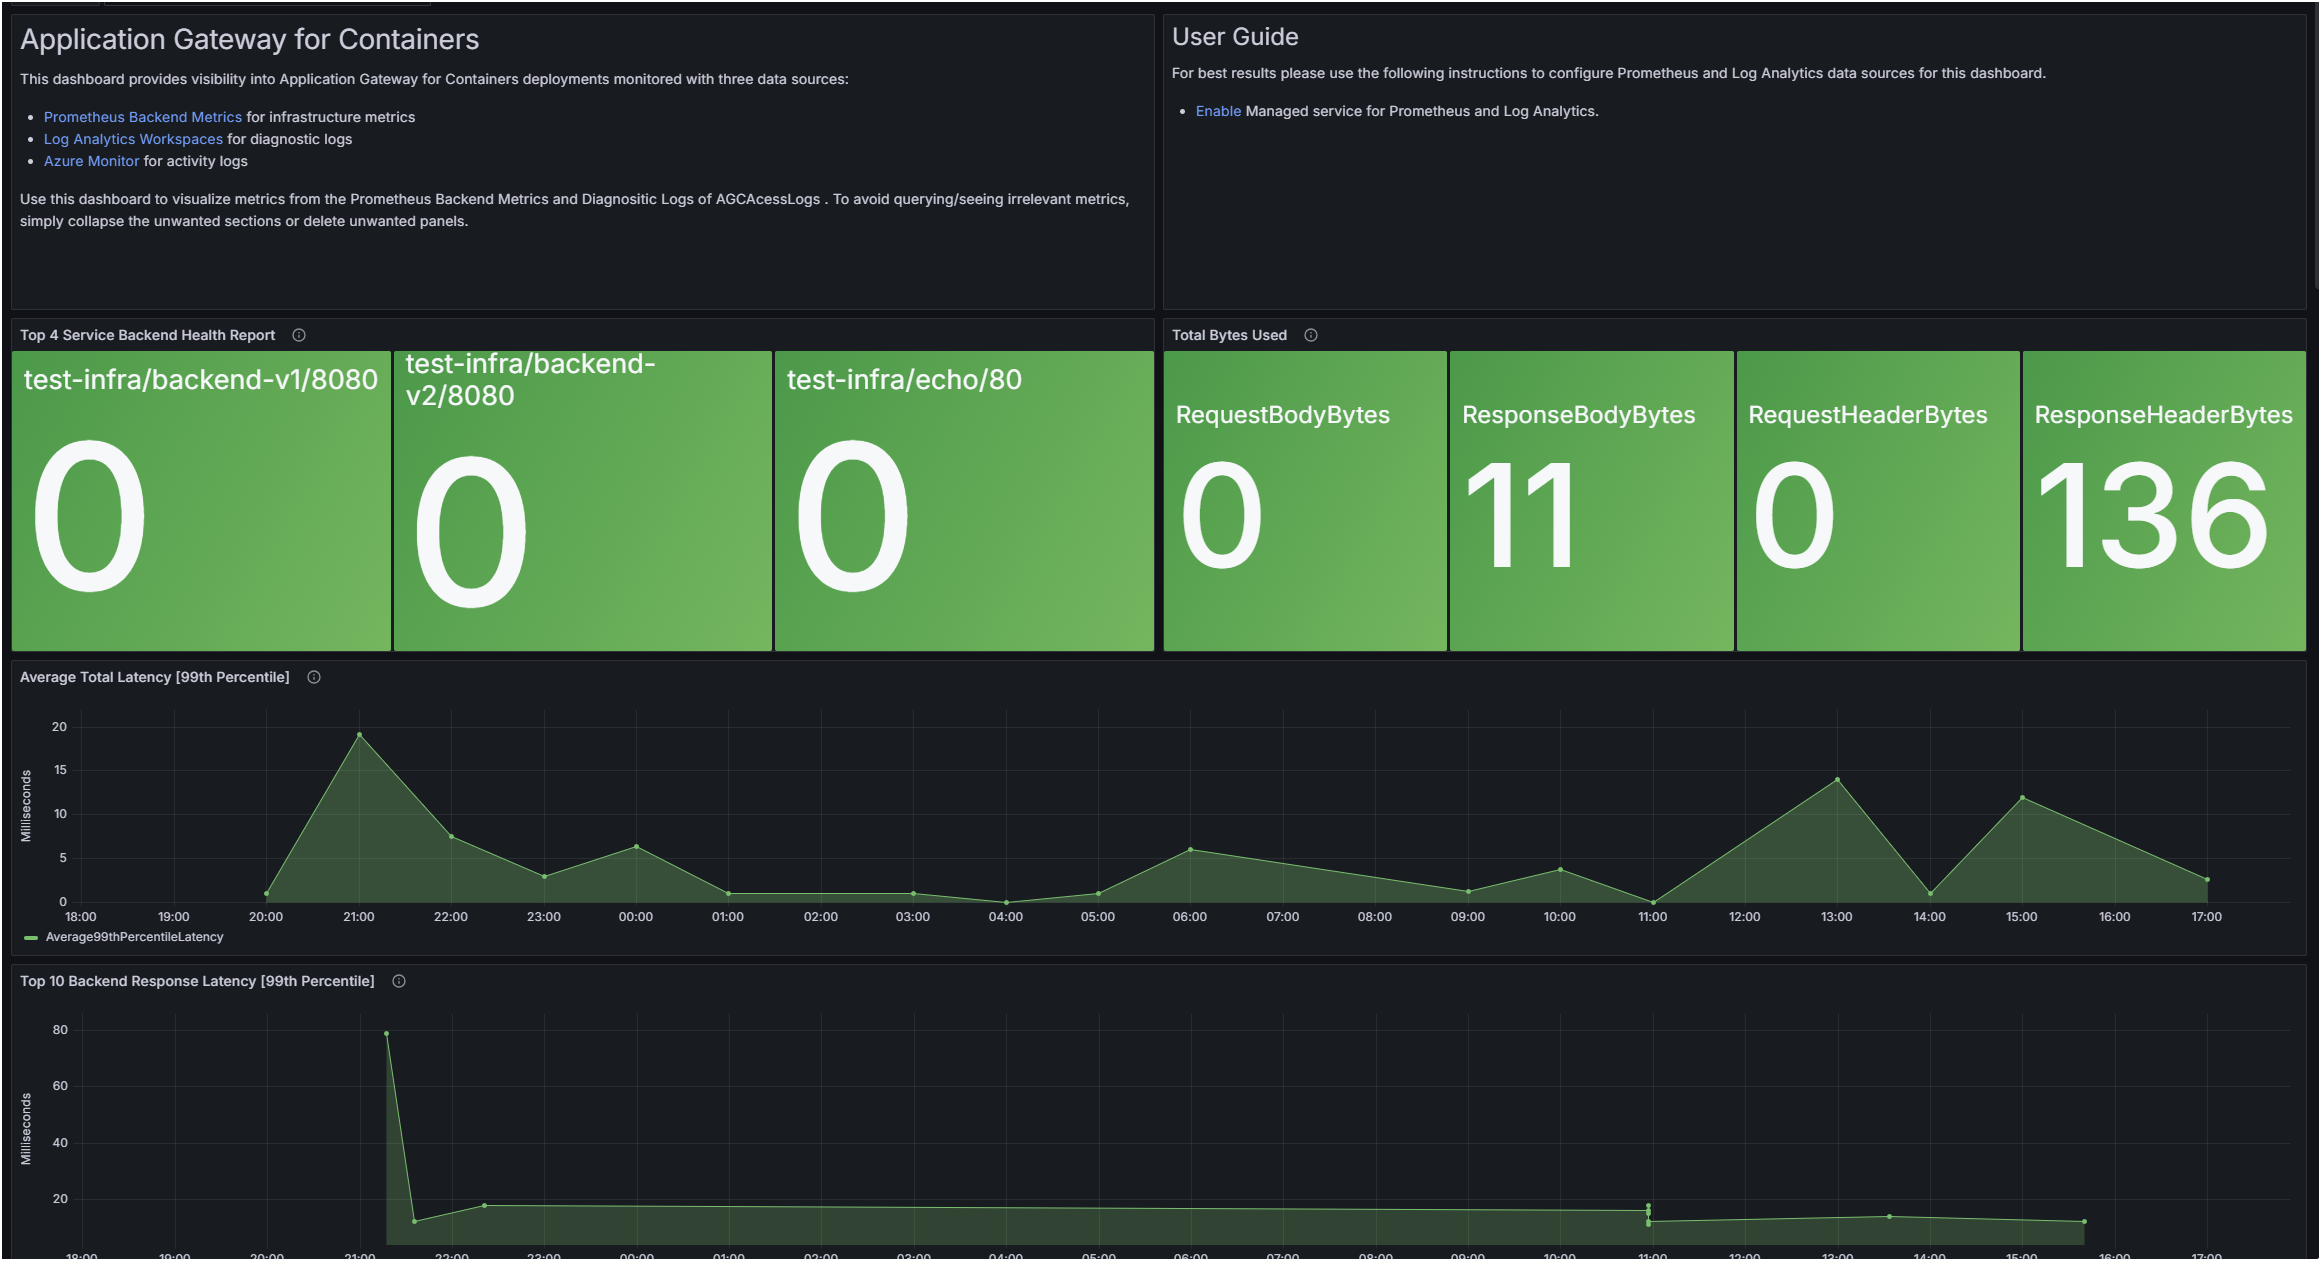
The Application Gateway / Container / Metrics dashboard uses the grafana-azure-monitor-datasource and prometheus data sources to create a Grafana dashboard with the barchart, bargauge, gauge, stat, text and timeseries panels.
Data source config
Collector type:
Collector plugins:
Collector config:
Revisions
Upload an updated version of an exported dashboard.json file from Grafana
| Revision | Description | Created | |
|---|---|---|---|
| Download |