Tarantool 3 dashboard
Dashboard for Tarantool 3 application and database server monitoring, based on grafonnet library.
About project
This is the dashboard for Tarantool 3 applications.
This dashboard is based on grafonnet library. Sources are available in project's GitHub page.
Configuration
The dashboard is designed to work with Tarantool + Telegraf + InfluxDB + Grafana cluster.
Tarantool configuration
The dashboard is designed to work with Tarantool metrics module, which is a part of Tarantool 3 core binary. Make sure you have an alias label for each instance (set by default if configuration is used), so metrics will be splitted and displayed correctly.
Each instance must be configured to have a json metrics endpoint for Telegraf (refer to documentation page for instructions). For HTTP panels, HTTP routing middleware with summary collector must be enabled. (See more on HTTP middleware in metrics documentation.)
To support CRUD statistics, install CRUD 0.11.1 or newer. Use CRUD configuration to enable statistics collect with latency quantiles.
To support expirationd statistics, install expirationd 1.2.0 or newer. Use expirationd configuration to enable statistics export.
Telegraf configuration
Telegraf must be configured to have data_format set as "json" and fieldpass list set as ["value"]; tag_keys list must contain "metric_name", "label_pairs_alias", "label_pairs_quantile", "label_pairs_path", "label_pairs_method", "label_pairs_status", "label_pairs_operation", "label_pairs_level", "label_pairs_id", "label_pairs_engine", "label_pairs_name", "label_pairs_index_name", "label_pairs_delta", "label_pairs_stream" values. You can also check out example config on GitHub.
Dashboard
Metrics used in dashboard are based on Tarantool metrics module. Time series are grouped by alias parameter, so you can use this dashboard to monitor a cluster of Tarantool instances.
Dashboard contains the following sections:
- Cluster overview
- Replication overview
- Tarantool HTTP statistics
- Tarantool network activity
- Tarantool memtx allocation overview
- Tarantool MVCC overview
- Tarantool vinyl statistics
- Tarantool CPU statistics
- Tarantool runtime overview
- Tarantool LuaJit statistics
- Tarantool operations statistics
- CRUD module statistics
- expirationd module statistics
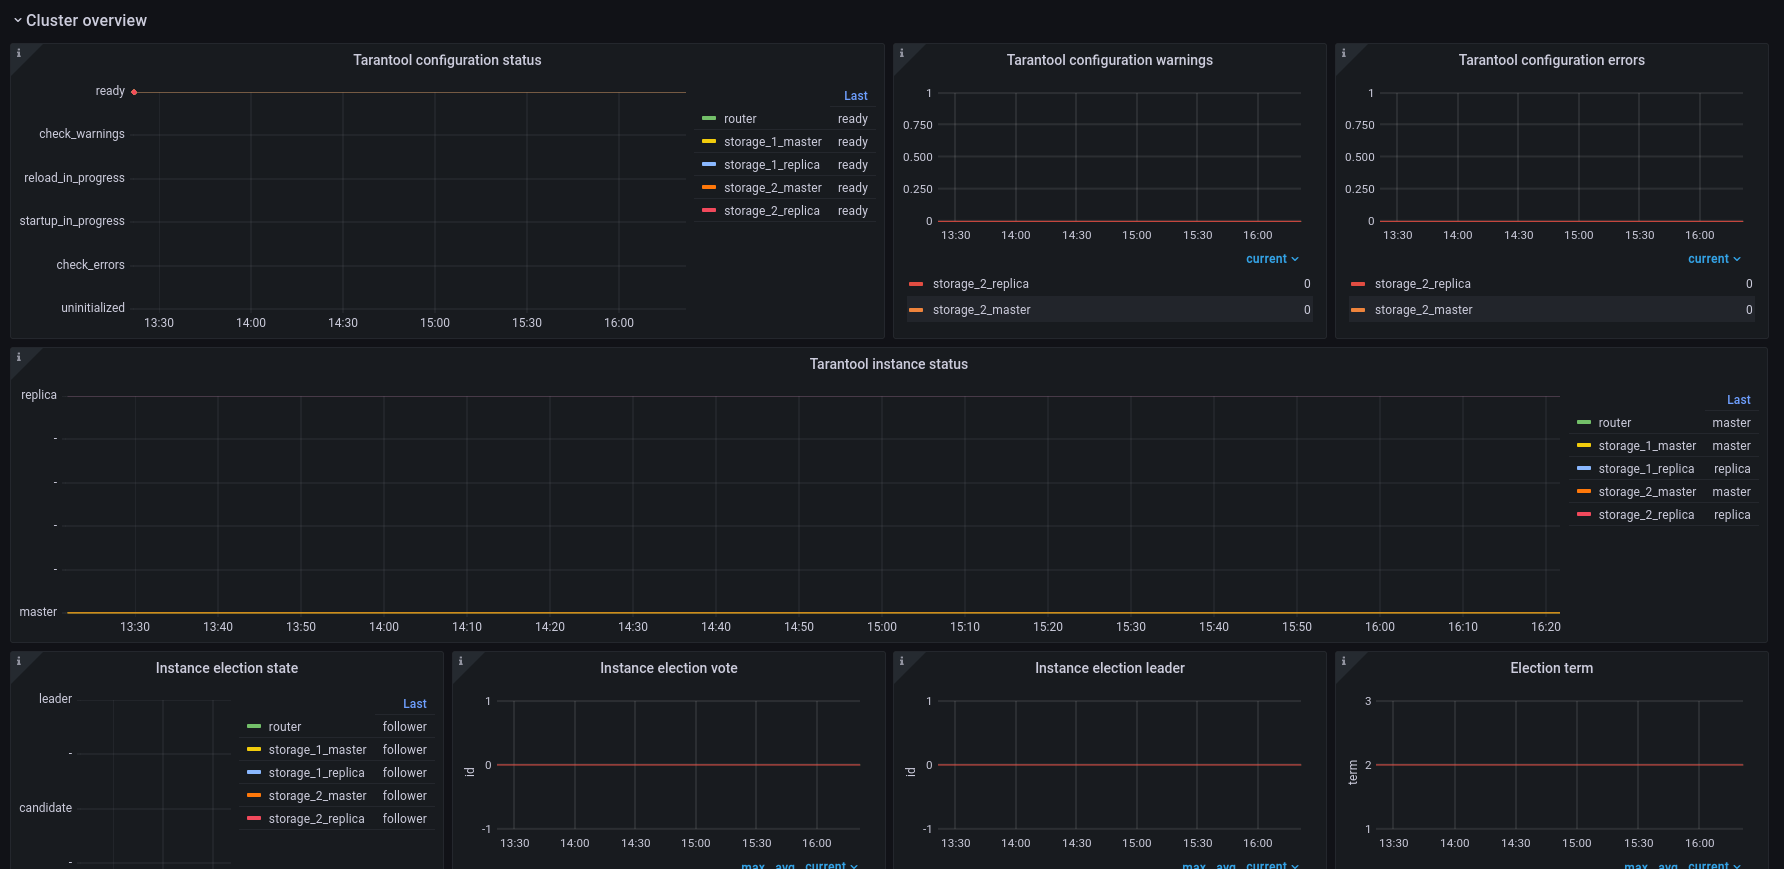
Cluster overview
Contains panels on configuration status with alerts, read only status and election info.
Replication overview
Contains info about replication lag and status, synchronous queue statistics.
Tarantool HTTP statistics
Overview of processed HTTP requests on Tarantool's side, grouped by method, path and response code. There are two lines of panels: one on rps and the other on 99th percentile of latency.
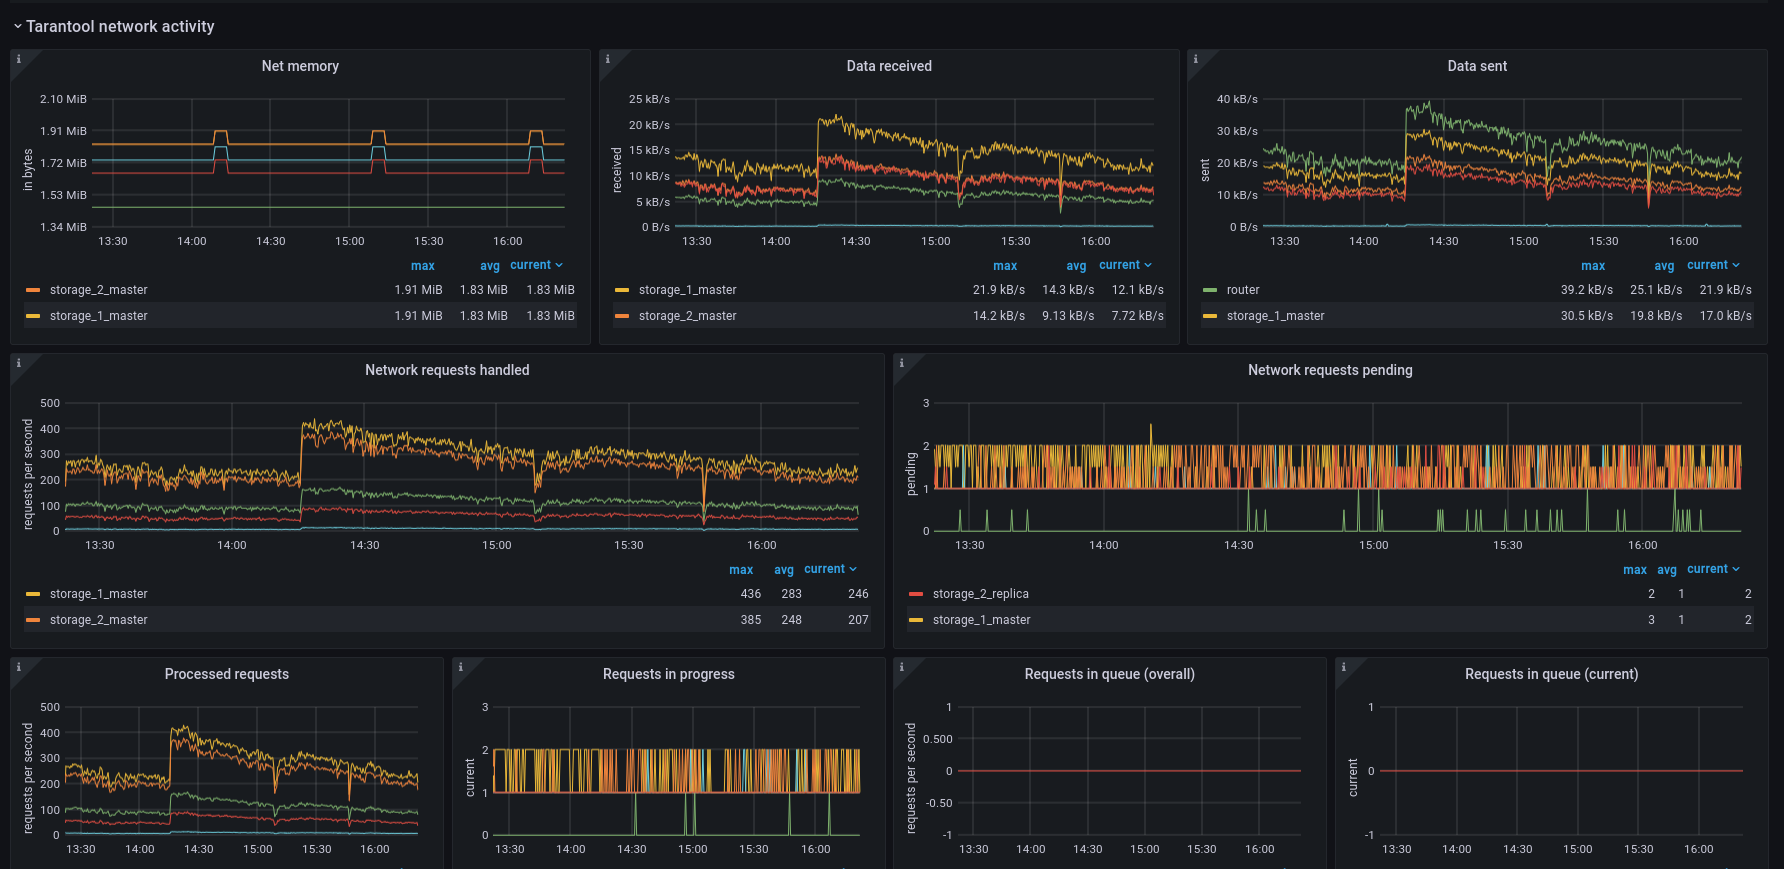
Tarantool network activity
Overview of instances network activity. Displays input and output data load, as well as network connections, detailed requests stats and memory consumption.
Tarantool memtx allocation overview
Overview of Tarantool memtx memory allocation (tuples and indexes). Contains short instruction on memory allocation monitoring. You can read more about slab here.
Tarantool MVCC overview
Contains statistics of Tarantool memtx engine transactions manager.
Tarantool vinyl statistics
Overview of Tarantool vinyl memory and disk allocation, vinyl scheduler process and transaction statistics. You can read more about vinyl engine here.
Tarantool CPU statistics
Contains CPU process time statistics for each instance.
Tarantool runtime overview
Metrics related to runtime. Contains Lua and transaction memory panels, fiber statistics panels and event loop panel.
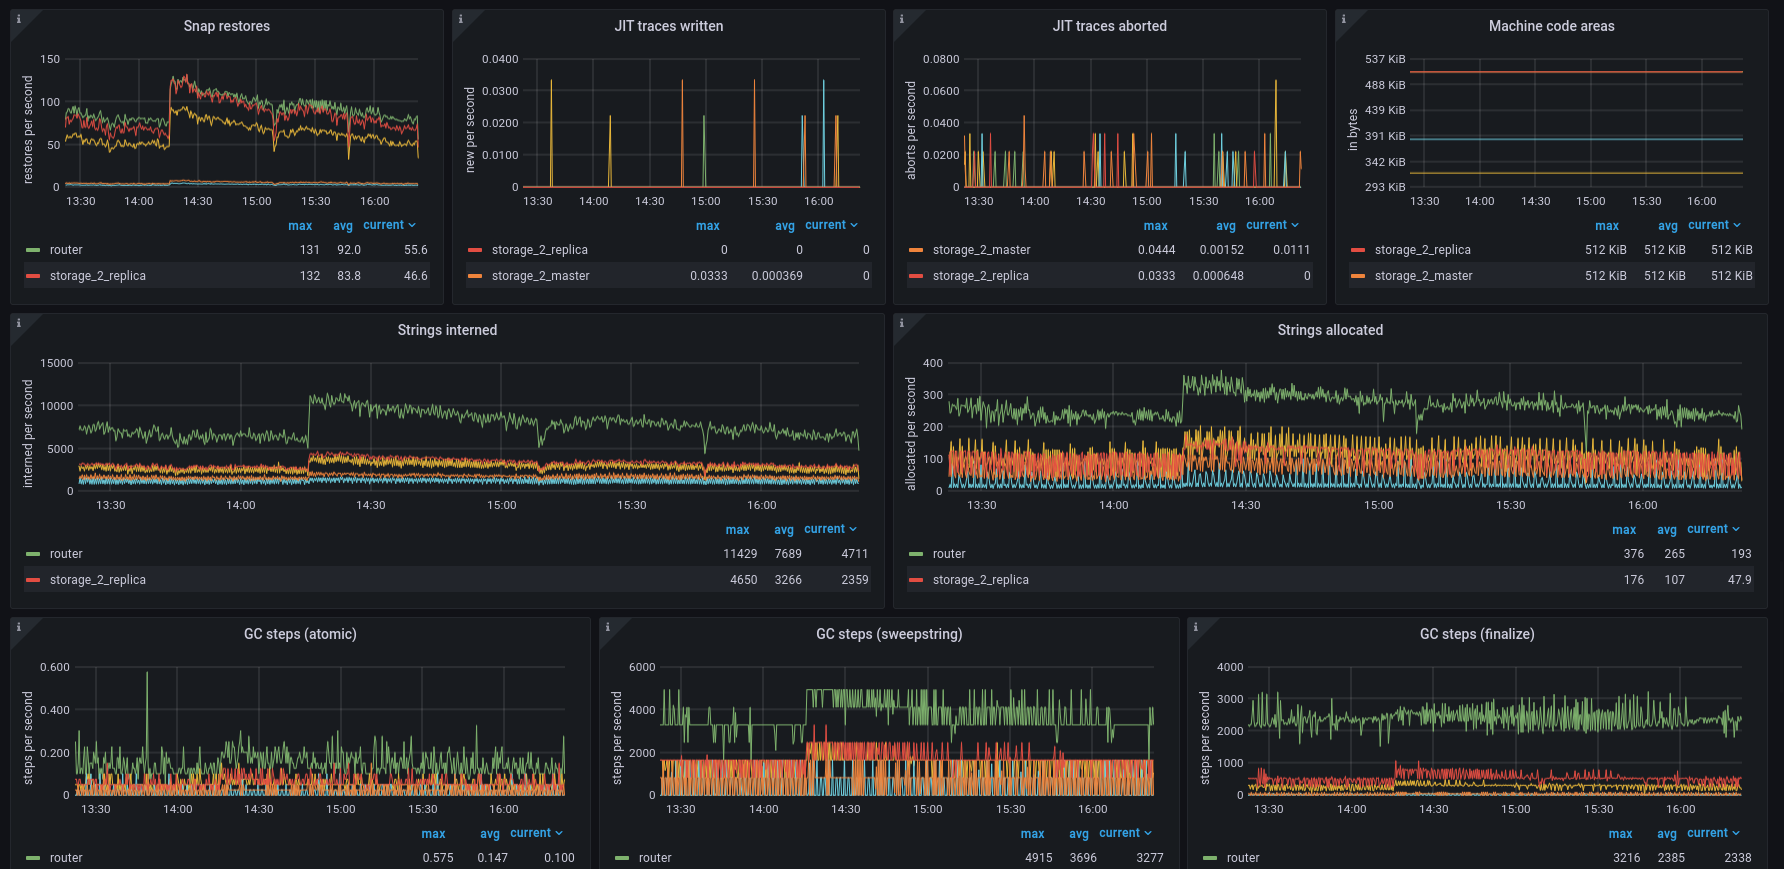
Tarantool LuaJit statistics
Detailed Lua runtime overview. Contains panels about objects allocation and garbage collect, memory consumption and LuaJit traces info.
Tarantool operations statistics
Overview of operations on Tarantool spaces (select, update, etc.) aggregated over all Tarantool spaces, as well as other operations activity (eval, call, auth, errors and SQL calls).
CRUD module statistics
Overview of CRUD module operations (crud.insert, crud.select, etc) separated by operation, cluster space and execution status. Contains RPS graphs, latency graphs and graphs with SELECT/PAIRS operations detailed info.
expirationd module statistics
Overview of expirationd module jobs: tuples statistics, restarts count and working time.
Contributing
Project is open-sourced, so you can freely file an issue with suggestion or bug report to our GitHub page.
Data source config
Collector config:
Upload an updated version of an exported dashboard.json file from Grafana
| Revision | Description | Created | |
|---|---|---|---|
| Download |