Docker daemon metrics
Docker daemon (engine) metrics
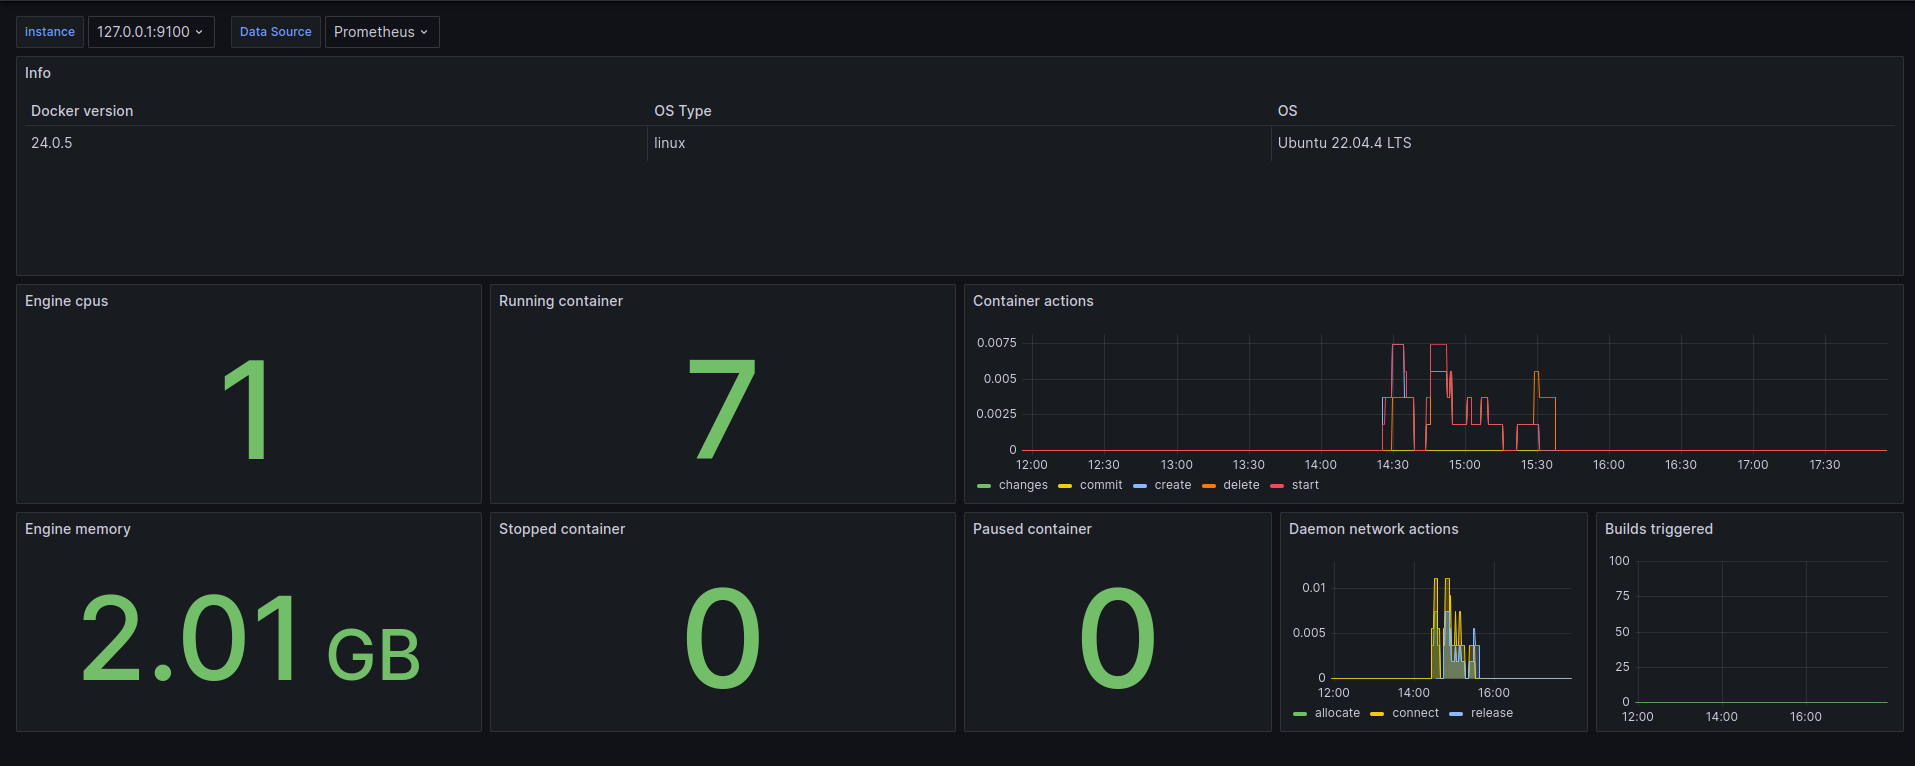
Collect Docker metrics with Prometheus
Currently, you can only monitor Docker itself. You can't currently monitor your application using the Docker target.
Configure the daemon
To configure the Docker daemon as a Prometheus target, you need to specify the metrics-address in the daemon.json configuration file. This daemon expects the file to be located at one of the following locations by default. If the file doesn't exist, create it.
- Linux: /etc/docker/daemon.json
- Windows Server: C:\ProgramData\docker\config\daemon.json
- Docker Desktop: Open the Docker Desktop settings and select Docker Engine to edit the file. Add the following configuration:
{
  "metrics-addr": "127.0.0.1:9323"
}
Save the file, or in the case of Docker Desktop for Mac or Docker Desktop for Windows, save the configuration. Restart Docker.
Docker now exposes Prometheus-compatible metrics on port 9323 on the loopback interface. arsalanse.ir
Data source config
Collector config:
Upload an updated version of an exported dashboard.json file from Grafana
| Revision | Description | Created | |
|---|---|---|---|
| Download |
Docker
Easily monitor Docker with Grafana Cloud's out-of-the-box monitoring solution.
Learn more