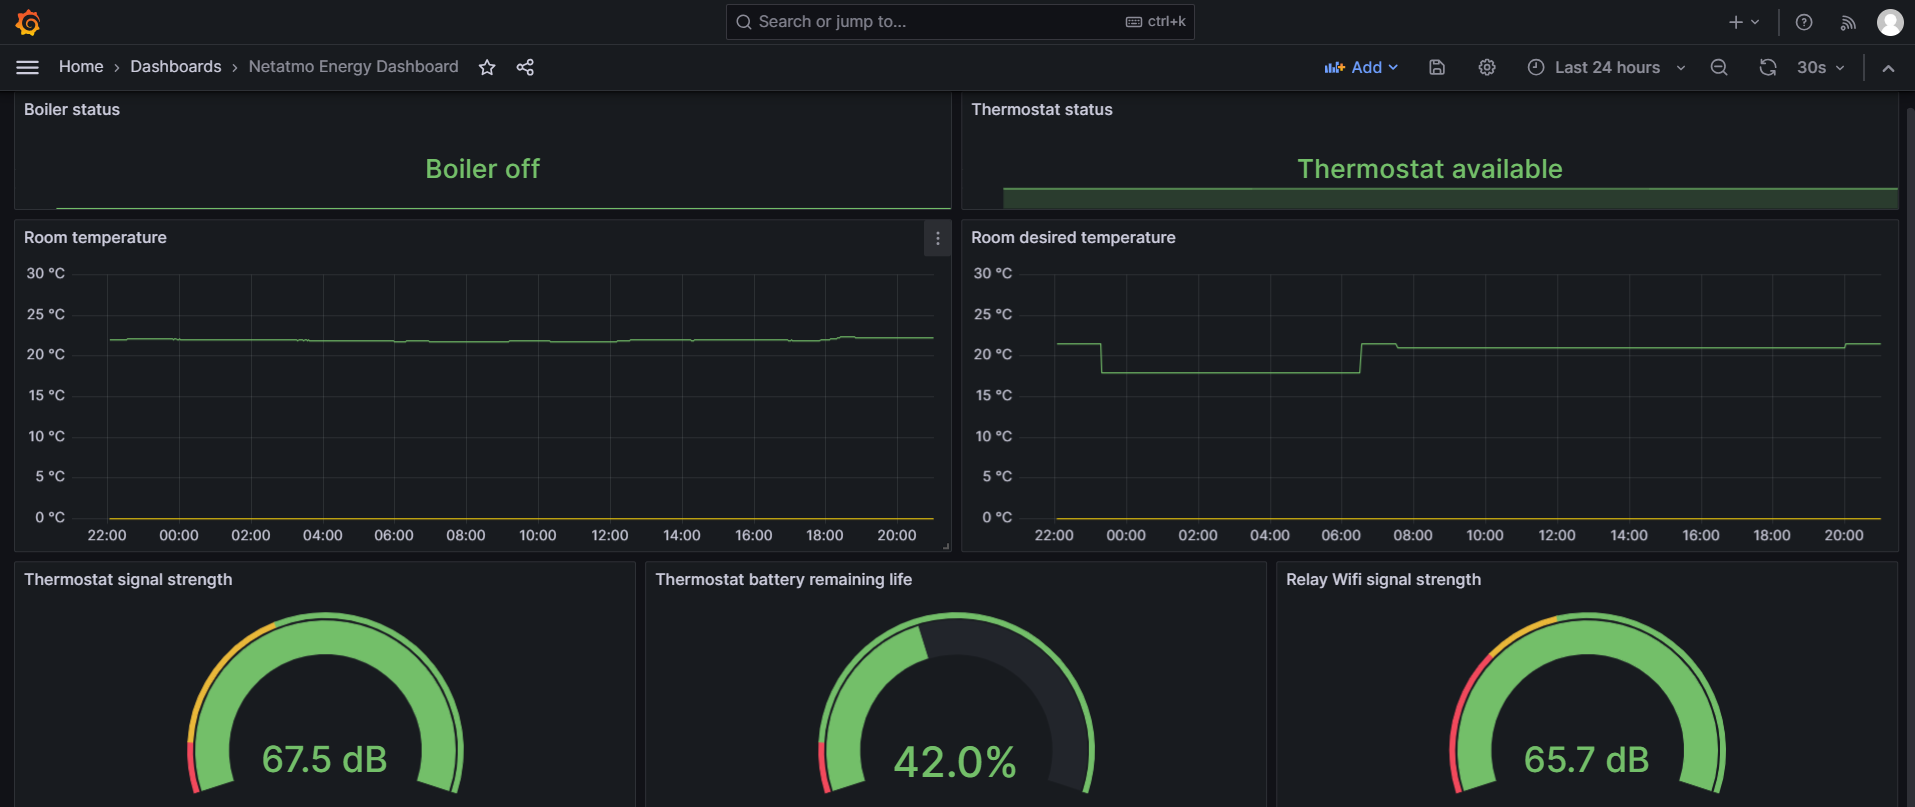
Netatmo Energy Dashboard
This dashboard is meant to be used with the Prometheus output Netatmo energy exporter. Docker image: https://hub.docker.com/r/vremenar/netatmo-energy-exporter Image built from: https://github.com/tipok/netatmo_energy_exporter
Netatmo Energy Prometheus Exporter
This is a Netatmo Energy exporter for Prometheus. It only works with Netatmo Energy (Comfort) products: Thermostat, Valves, etc. It has been tested with Netatmo Smart Thermostat.
Images are based on the work of tipok and his netatmo_energy_exporter.
How to run
Credentials
In order to access the Netatmo data you will need an active Netatmo account and you'll need to create Client ID, Client Secret and Refresh Token on Netatmo Developer Portal.
Easiest way to run it
docker run -d -p 2112:2112 vremenar/netatmo-energy-exporter:arm64 \
   --client-id=${CLIENT_ID} --client-secret=${CLIENT_SECRET} \
   --username=${USERNAME} --password=${PASSWORD} \
   --refresh-token=${REFRESH_TOKEN}
Docker Compose
services:
  netatmo-exporter:
    container_name: netatmo-exporter
    image: vremenar/netatmo-energy-exporter:arm64
    command:
      - '--client-id=${CLIENT_ID}'
      - '--client-secret=${CLIENT_SECRET}'
      - '--refresh-token=${REFRESH_TOKEN}'
      - '--username=${USERNAME}'
      - '--password=${PASSWORD}'
    logging:
      driver: "json-file"
      options:
        max-size: "5k"
        max-file: "5"
    healthcheck:
      test: ["CMD", "wget", "--spider", "http://localhost:2112/metrics"]
      interval: 300s
      retries: 5
      timeout: 10s
    restart: always
Data source config
Collector config:
Upload an updated version of an exported dashboard.json file from Grafana
| Revision | Description | Created | |
|---|---|---|---|
| Download |

