
CloudNativePG
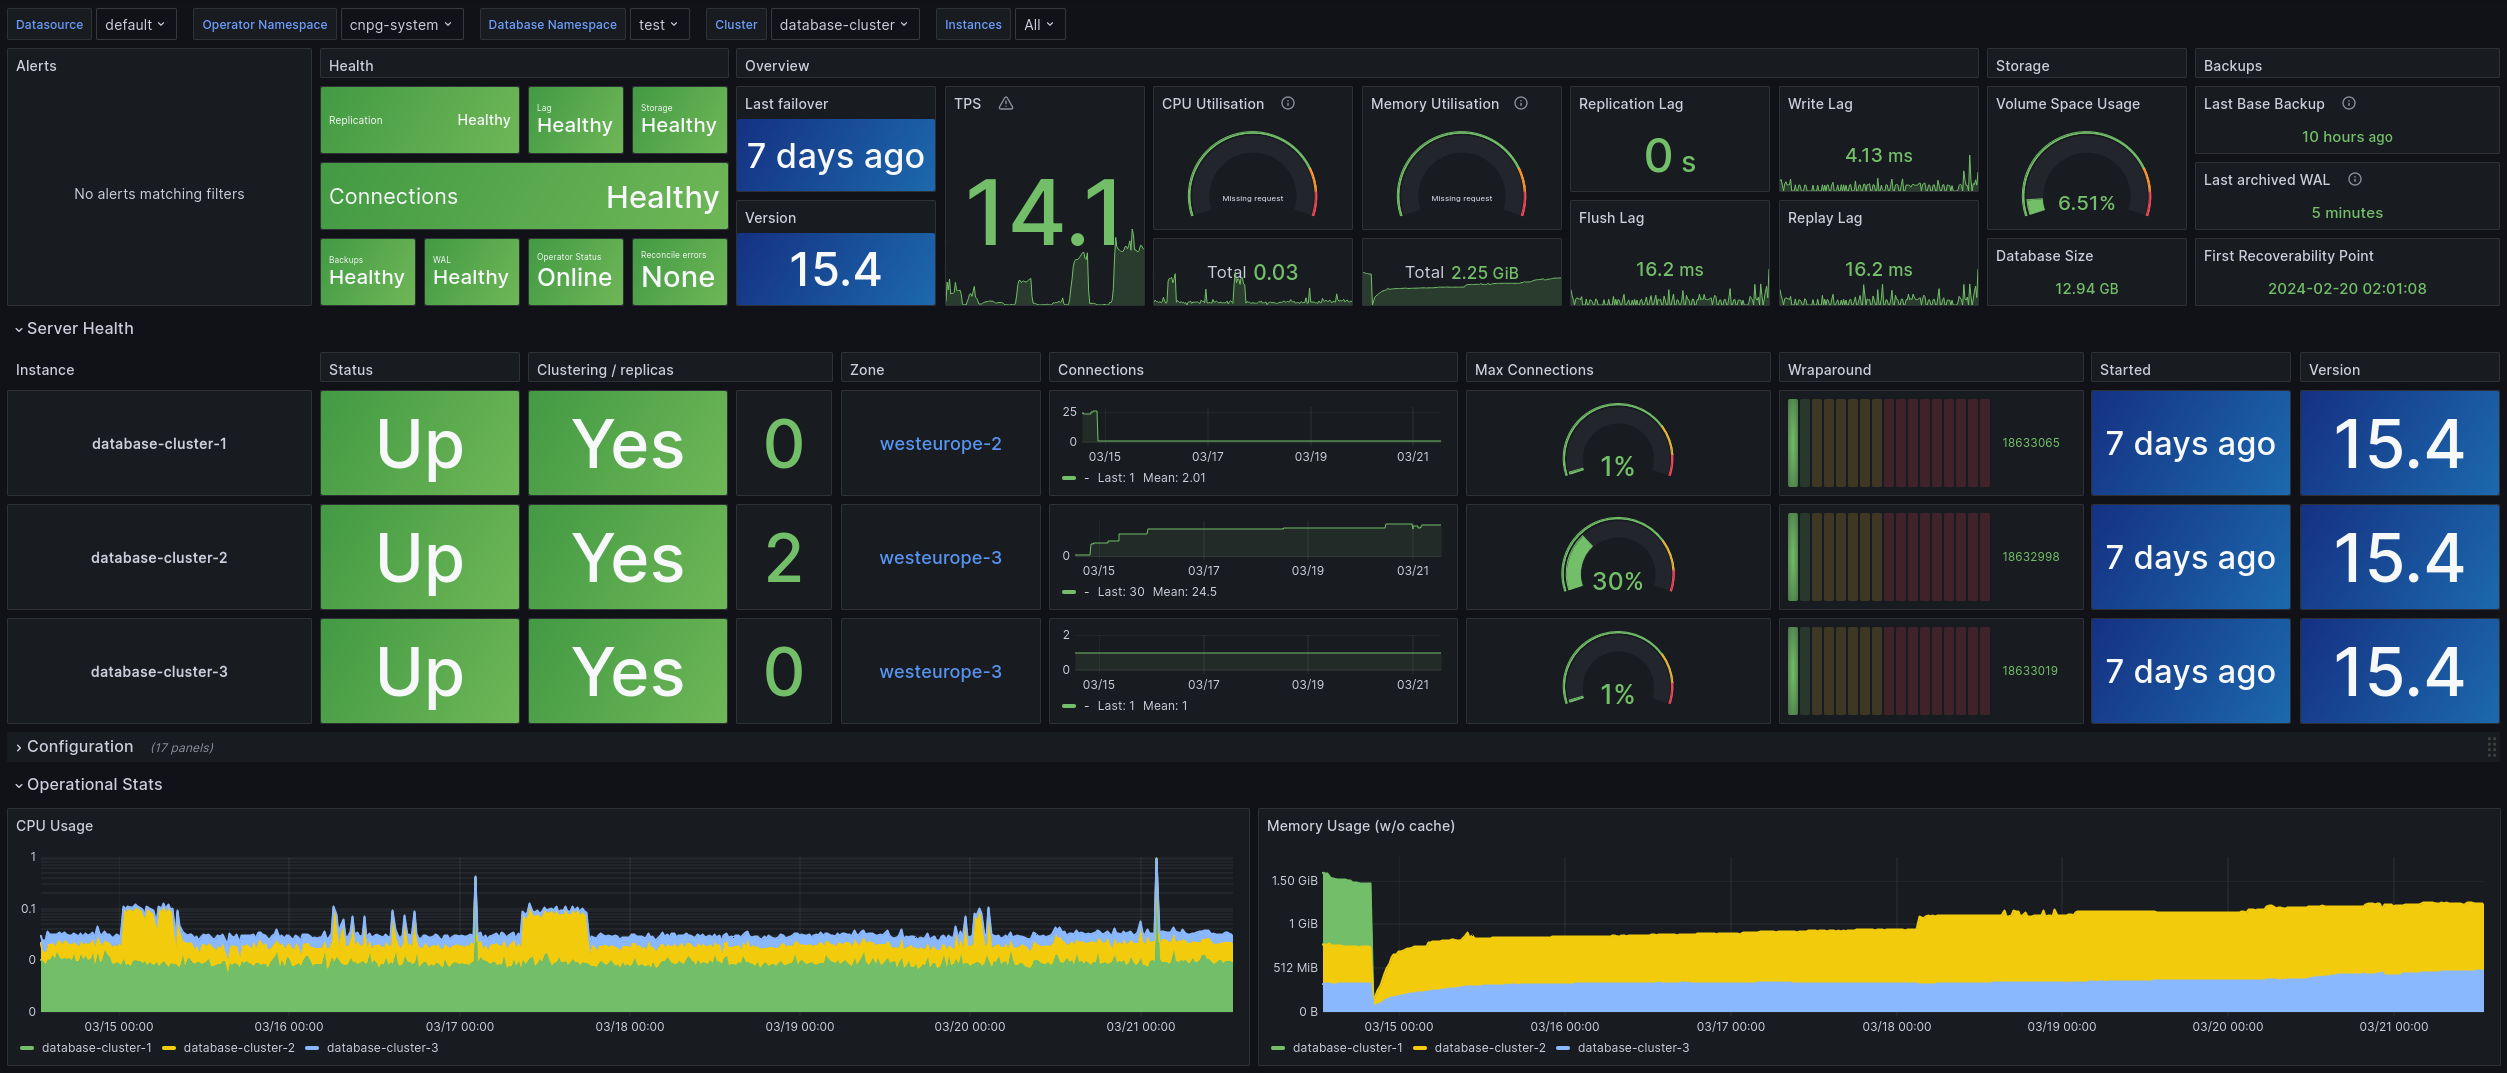
Refer to the Monitoring documentation on how to enable monitoring for your cluster and/or export custom metrics.
Source Code: GitHub
Prometheus Operator example
A specific PostgreSQL cluster can be monitored using the Prometheus Operator's resource PodMonitor. A PodMonitor correctly pointing to a Cluster can be automatically created by the operator by setting .spec.monitoring.enablePodMonitor to true in the Cluster resource itself (default: false).
apiVersion: postgresql.cnpg.io/v1
kind: Cluster
metadata:
  name: cluster-example
  namespace: test
spec:
  instances: 3
storage:
size: 1Gi
monitoring:
enablePodMonitor: true
User defined metrics
Custom metrics can be defined by users by referring to the created Configmap/Secret in a Cluster definition under the .spec.monitoring.customQueriesConfigMap or customQueriesSecret section as in the following example:
apiVersion: postgresql.cnpg.io/v1
kind: Cluster
metadata:
  name: cluster-example
  namespace: test
spec:
  instances: 3
storage:
size: 1Gi
monitoring:
customQueriesConfigMap:
- name: example-monitoring
key: custom-queries
Here you can see an example of a ConfigMap containing a single custom query, referenced by the Cluster example above:
apiVersion: v1
kind: ConfigMap
metadata:
  name: example-monitoring
  namespace: test
  labels:
    cnpg.io/reload: ""
data:
  custom-queries: |
    pg_replication:
      query: "SELECT CASE WHEN NOT pg_is_in_recovery()
              THEN 0
              ELSE GREATEST (0,
                EXTRACT(EPOCH FROM (now() - pg_last_xact_replay_timestamp())))
              END AS lag,
              pg_is_in_recovery() AS in_recovery,
              EXISTS (TABLE pg_stat_wal_receiver) AS is_wal_receiver_up,
              (SELECT count(*) FROM pg_stat_replication) AS streaming_replicas"
  metrics:
    - lag:
        usage: "GAUGE"
        description: "Replication lag behind primary in seconds"
    - in_recovery:
        usage: "GAUGE"
        description: "Whether the instance is in recovery"
    - is_wal_receiver_up:
        usage: "GAUGE"
        description: "Whether the instance wal_receiver is up"
    - streaming_replicas:
        usage: "GAUGE"
        description: "Number of streaming replicas connected to the instance"
A list of basic monitoring queries can be found in the default-monitoring.yaml file that is already installed in your CloudNativePG deployment (see "Default set of metrics").
Data source config
Collector config:
Upload an updated version of an exported dashboard.json file from Grafana
| Revision | Description | Created | |
|---|---|---|---|
| Download |