
Zabbix Server status
Internal metrics of Zabbix server.
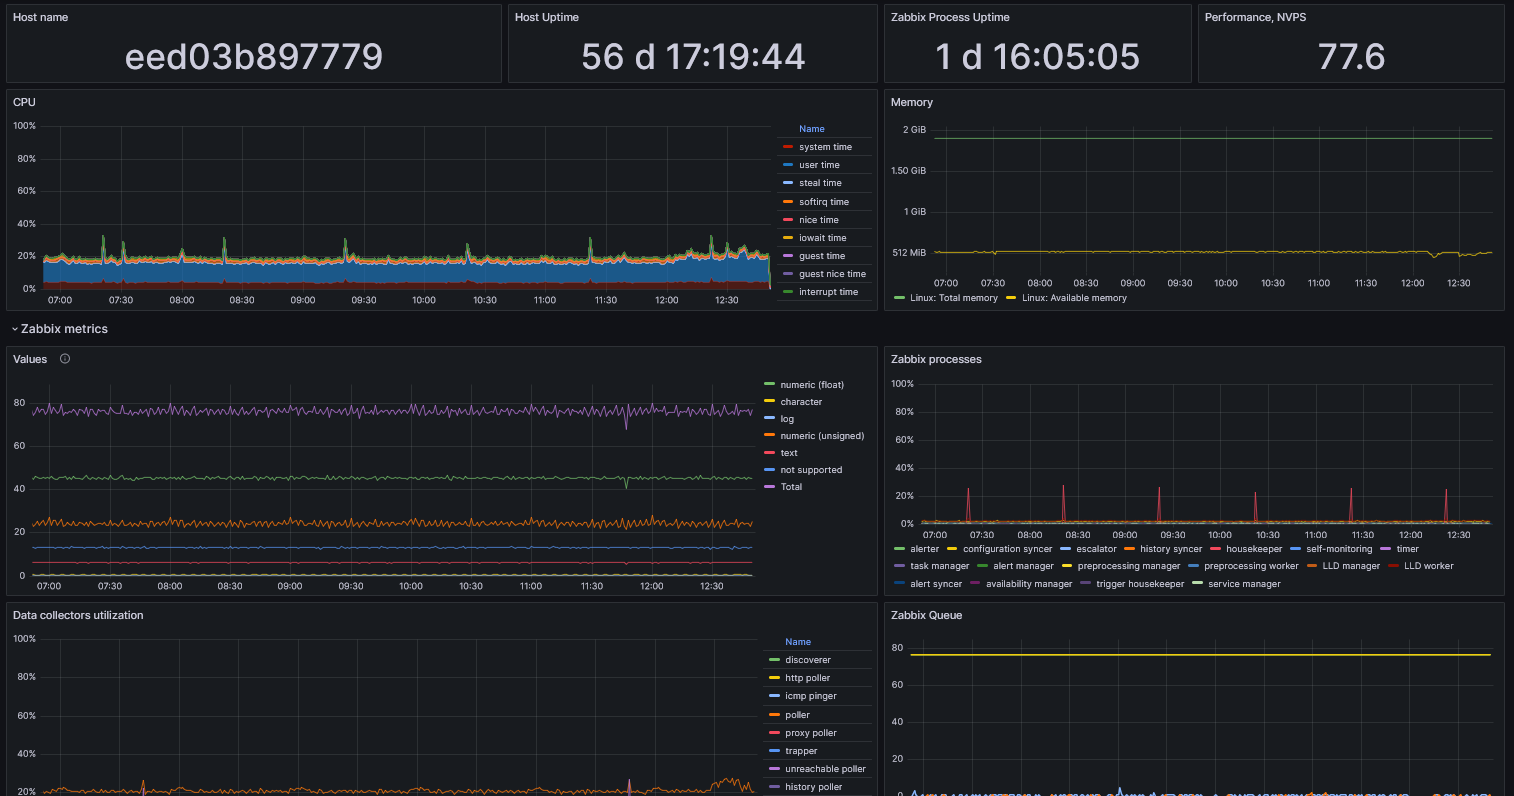
Internal metric for Zabbix Server.
This dashboard is designed as a replacement for the standard Zabbix interface, which is heavily overloaded with texts. In addition to Zabbix metrics, it assumes that you are using a Zabbix Agent on Linux and its metrics.
Data source config
Collector type:
Collector plugins:
Collector config:
Revisions
Upload an updated version of an exported dashboard.json file from Grafana
| Revision | Description | Created | |
|---|---|---|---|
| Download |