Linux Procstat Monitoring
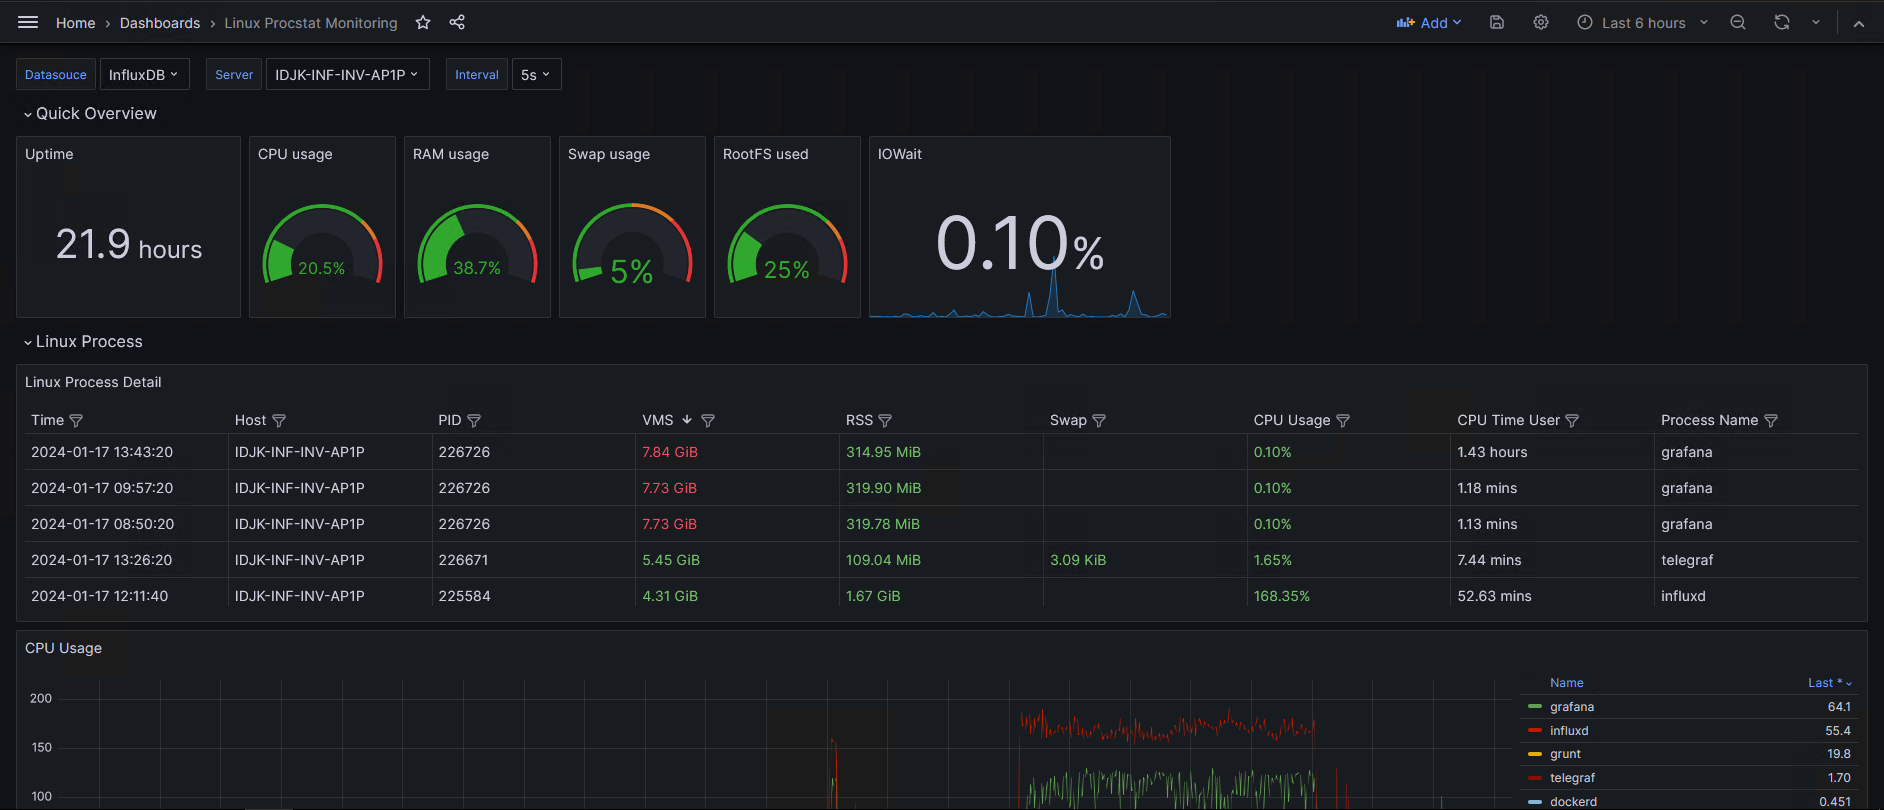
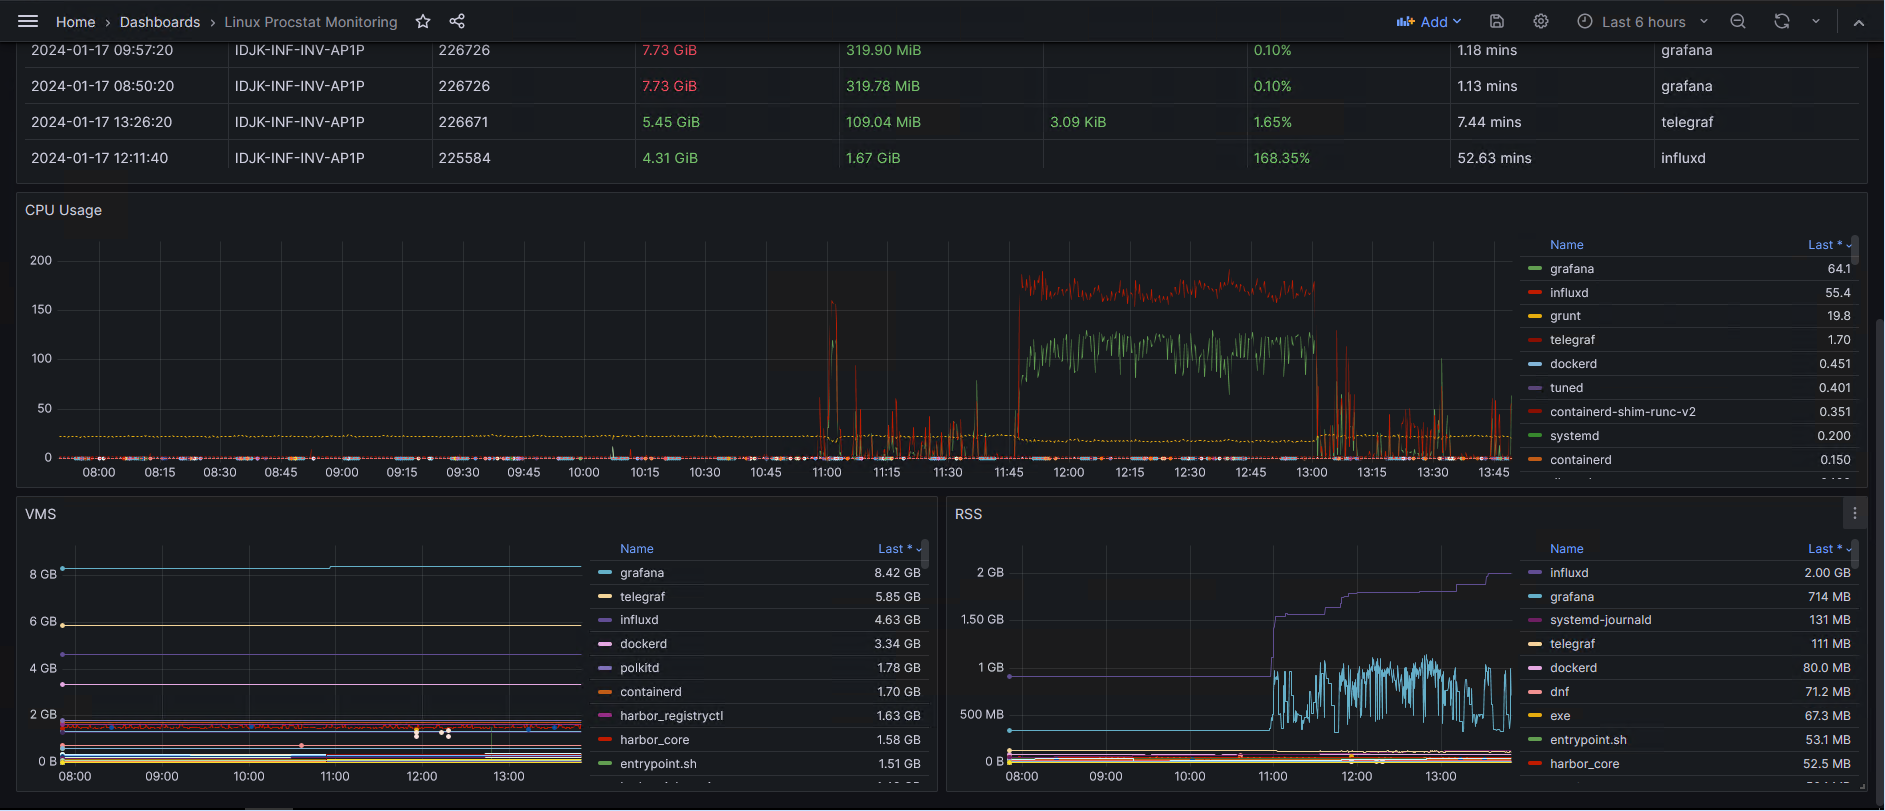
Displays detailed information about processes as identified by their pid arguments. View usage of VMS, RSS, CPU by process name and pid on Linux System.
View usage of VMS, RSS, CPU by process name and pid on Linux System. This dashboard also monitoring system; Uptime, CPU Usage, Memory Usage, Swap Usage, RootFS Usage, I/O Wait.
You need install InfluxDB OSS/v1 because this dashboard using InfluxQL.
You can using my blog website for guide (Indonesian Version).
Data source config
Collector config:
Upload an updated version of an exported dashboard.json file from Grafana
| Revision | Description | Created | |
|---|---|---|---|
| Download |
Linux Server
Monitor Linux with Grafana. Easily monitor your Linux deployment with Grafana Cloud's out-of-the-box monitoring solution.
Learn more

