
Grafana Internal Stats
Grafana Internal Metrics Dashboards
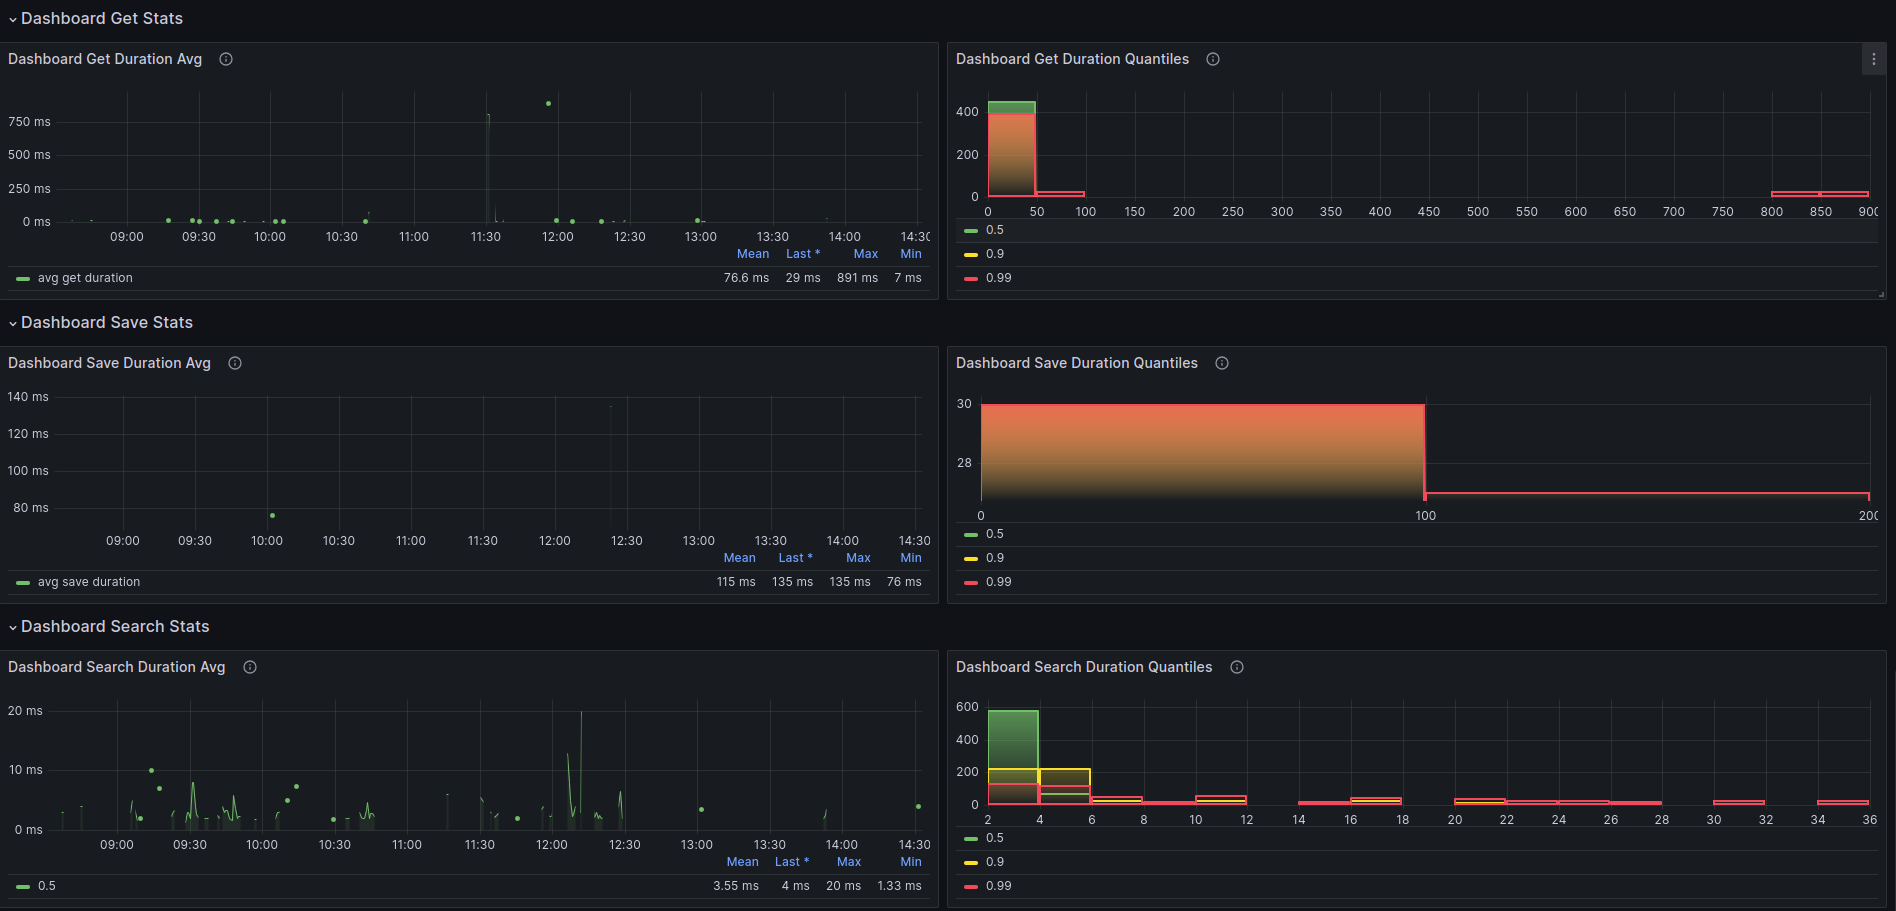
Grafana Internal Metrics Dashboard
This dashboard provides an overview of the internal metrics exposed by a Grafana server.
It helps operators monitor Grafana health, usage statistics, and resource consumption.
Features
This dashboard includes:
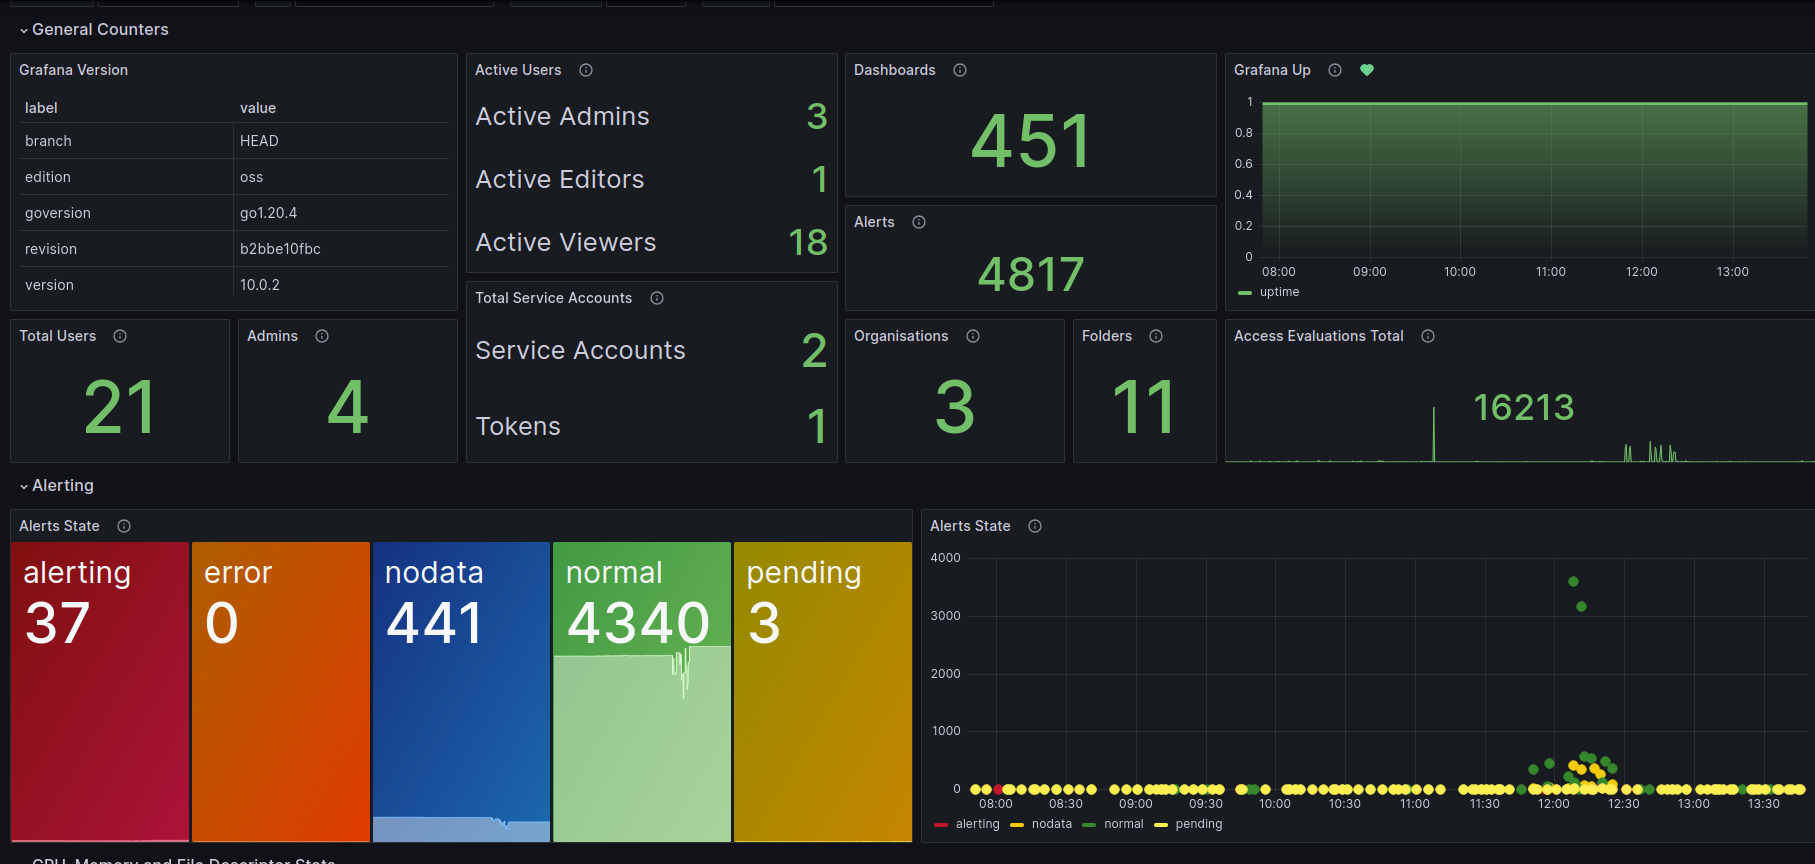
- Overview of Grafana internal statistics:
- Users
- Dashboards
- Alerts
- Folders
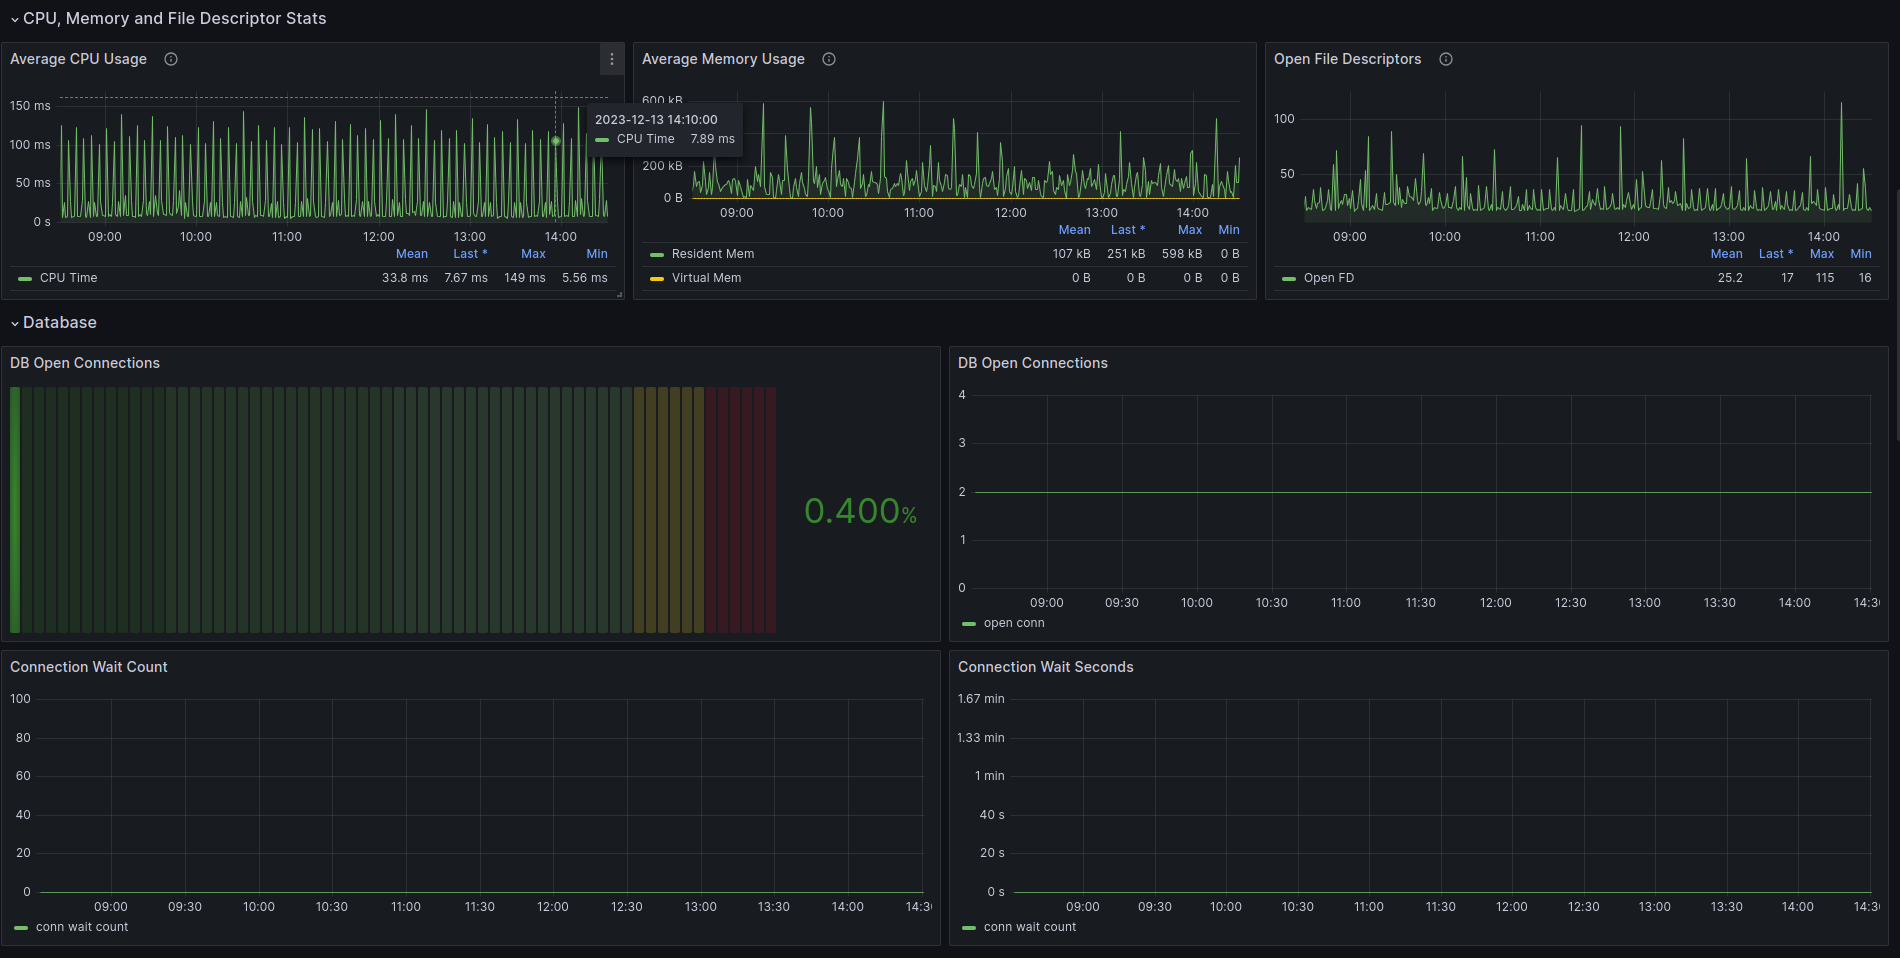
- Grafana process resource usage:
- CPU
- Memory
- File descriptors
- Grafana database metrics:
- Open connections
- Connection usage percentage
- High-level operational view of the Grafana server
Requirements
This dashboard uses the Grafana internal Prometheus metrics endpoint:
Recommended Use
This dashboard is useful for:
- Observability engineers
- SRE teams
- Grafana administrators
- Monitoring large Grafana deployments
Need Help With Grafana or Prometheus?
If you need help implementing production-grade monitoring or observability systems (Grafana, Prometheus, Kubernetes), feel free to reach out.
DevSecOps & Observability Engineer
Experience with large-scale infrastructure and EU projects.
LinkedIn:
https://www.linkedin.com/in/dimitris-kourlos-123456789012356789
Data source config
Collector type:
Collector plugins:
Collector config:
Revisions
Upload an updated version of an exported dashboard.json file from Grafana
| Revision | Description | Created | |
|---|---|---|---|
| Download |