
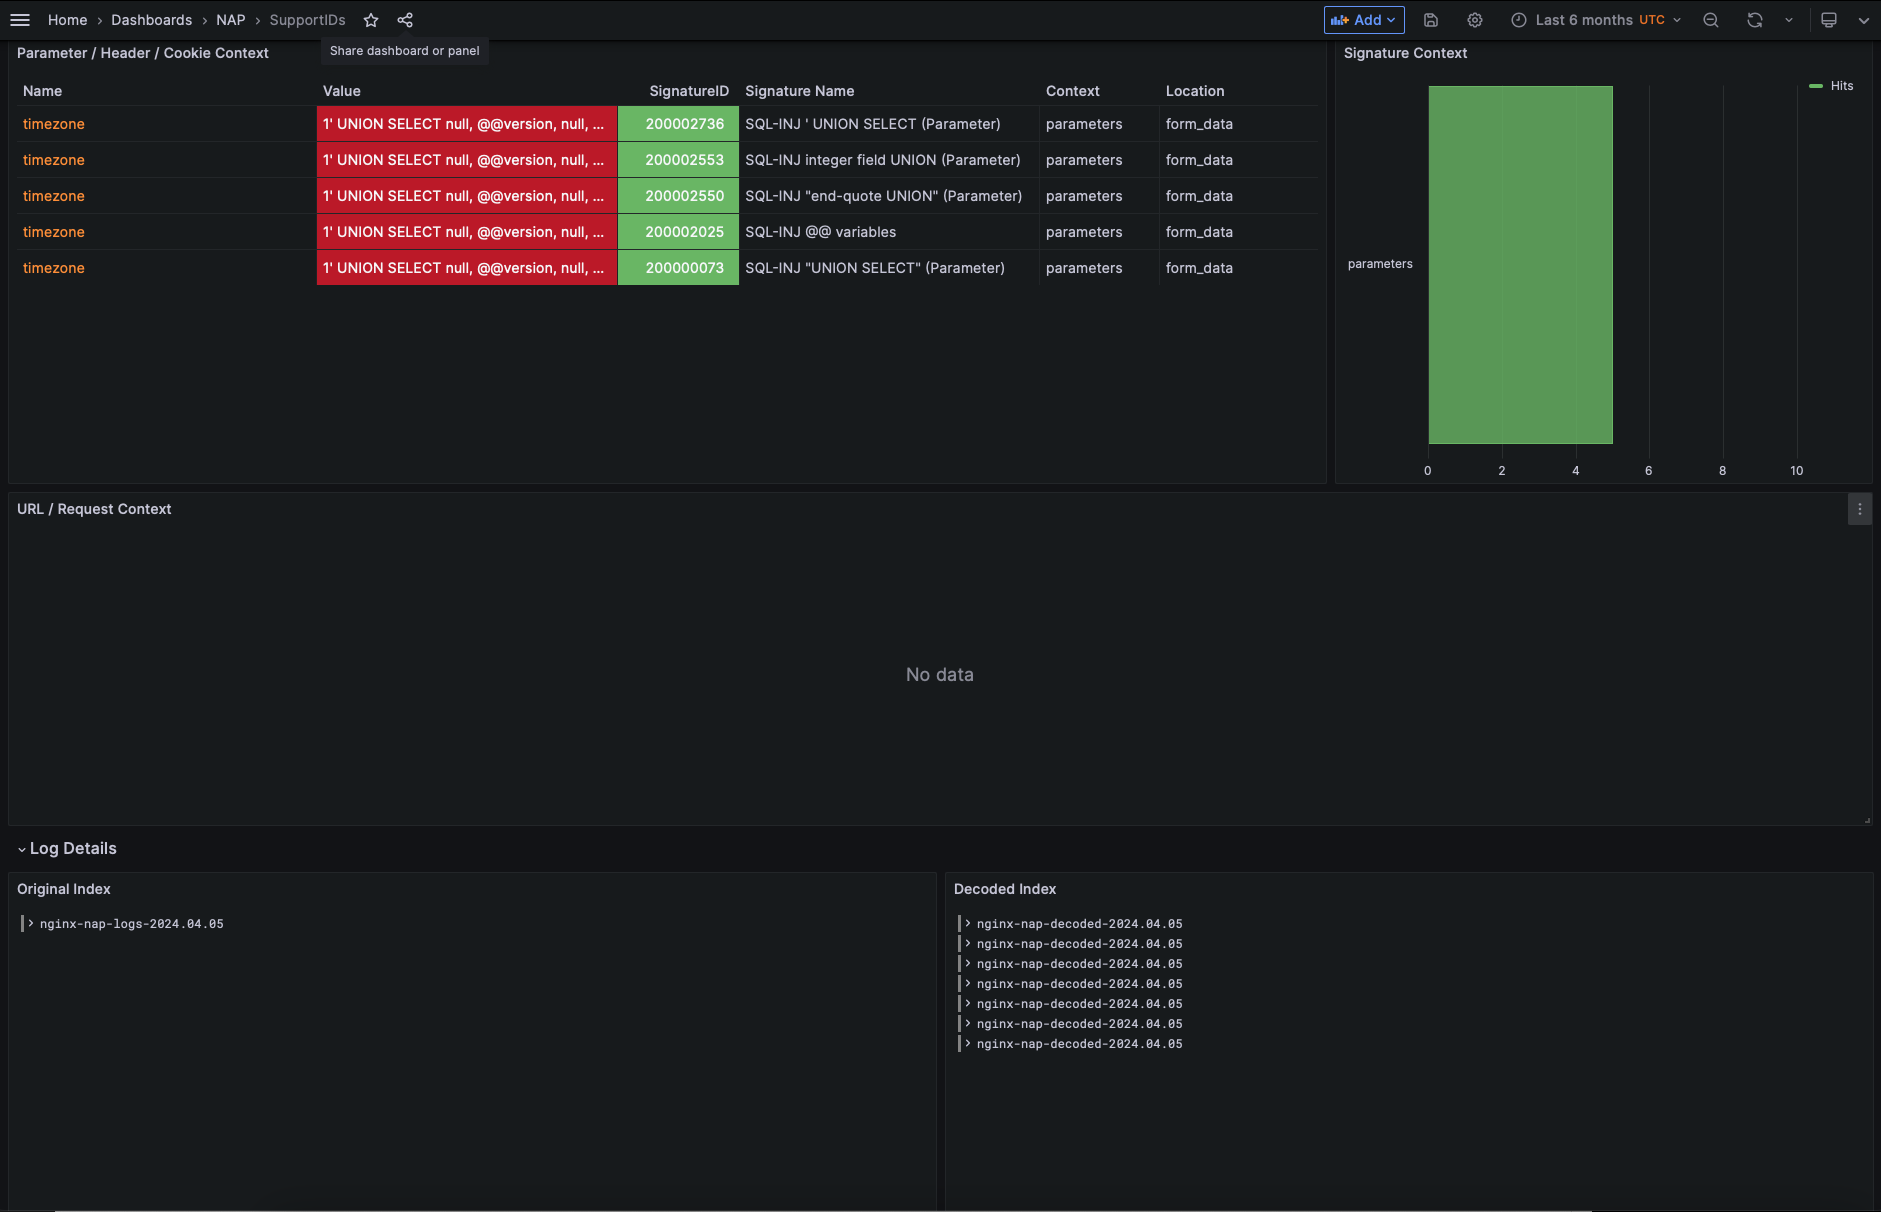
NAP - SupportIDs
This Dashboard provides more visibility into a single incident logged by NGINX App Protect. This is part of a series of NGINX App Protect Dashboards
For more information visit https://github.com/skenderidis/nap-dashboard
Data source config
Collector type:
Collector plugins:
Collector config:
Revisions
Upload an updated version of an exported dashboard.json file from Grafana
| Revision | Description | Created | |
|---|---|---|---|
| Download |