
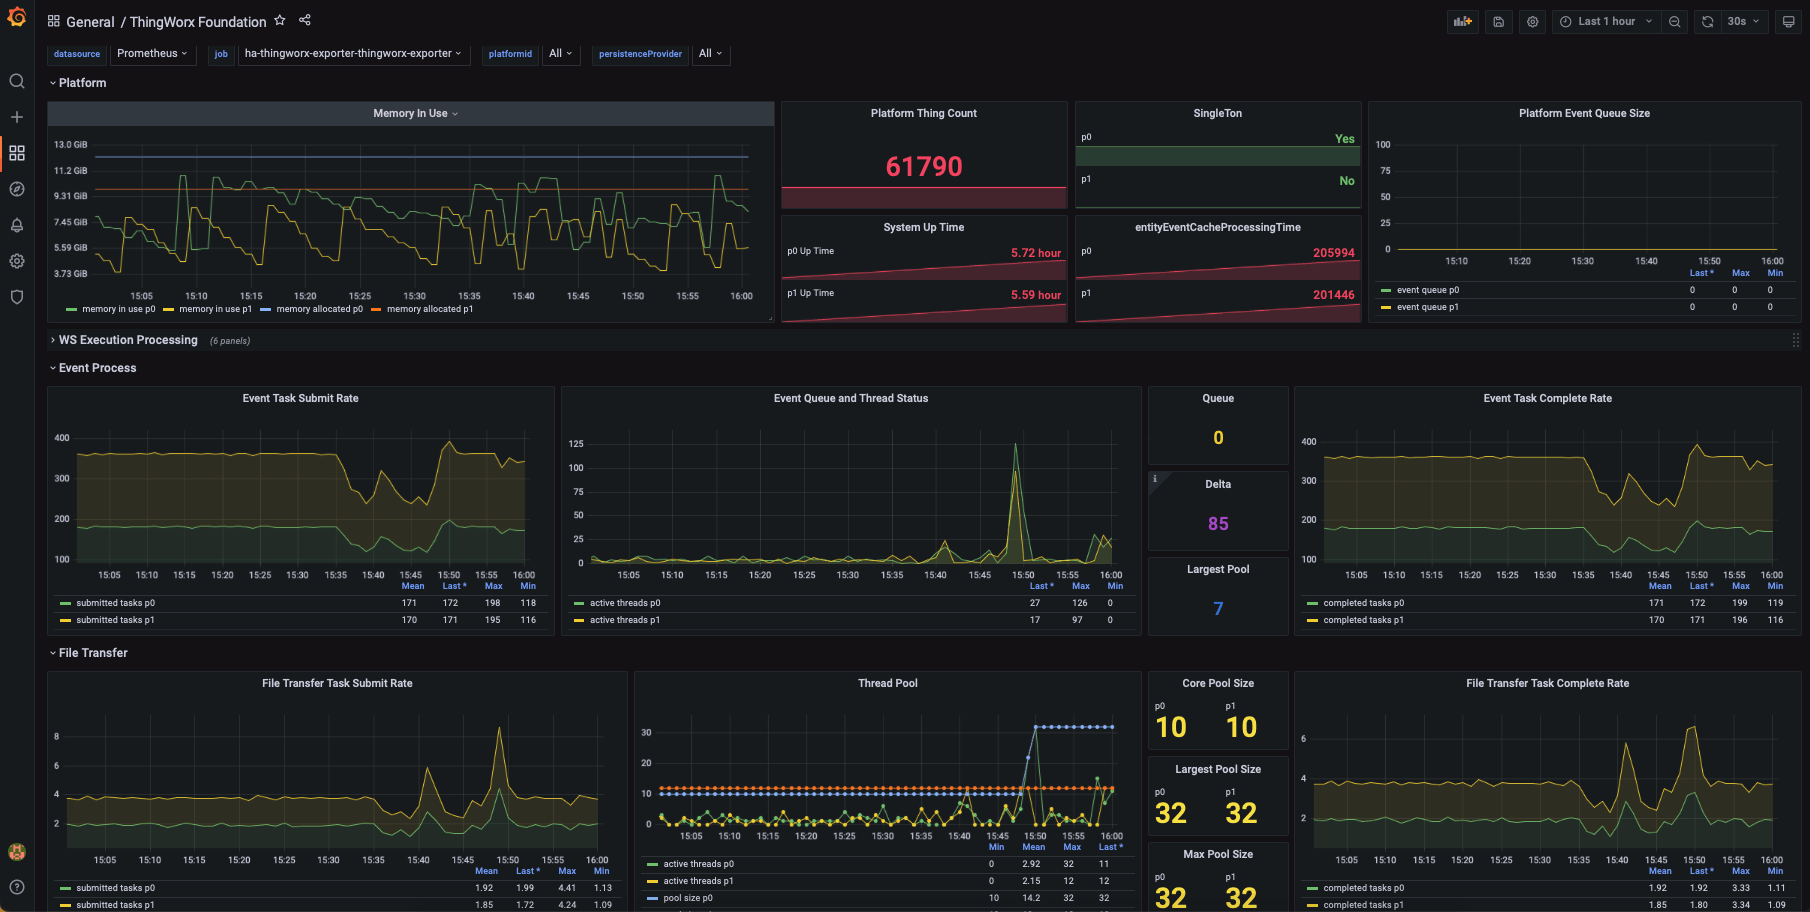
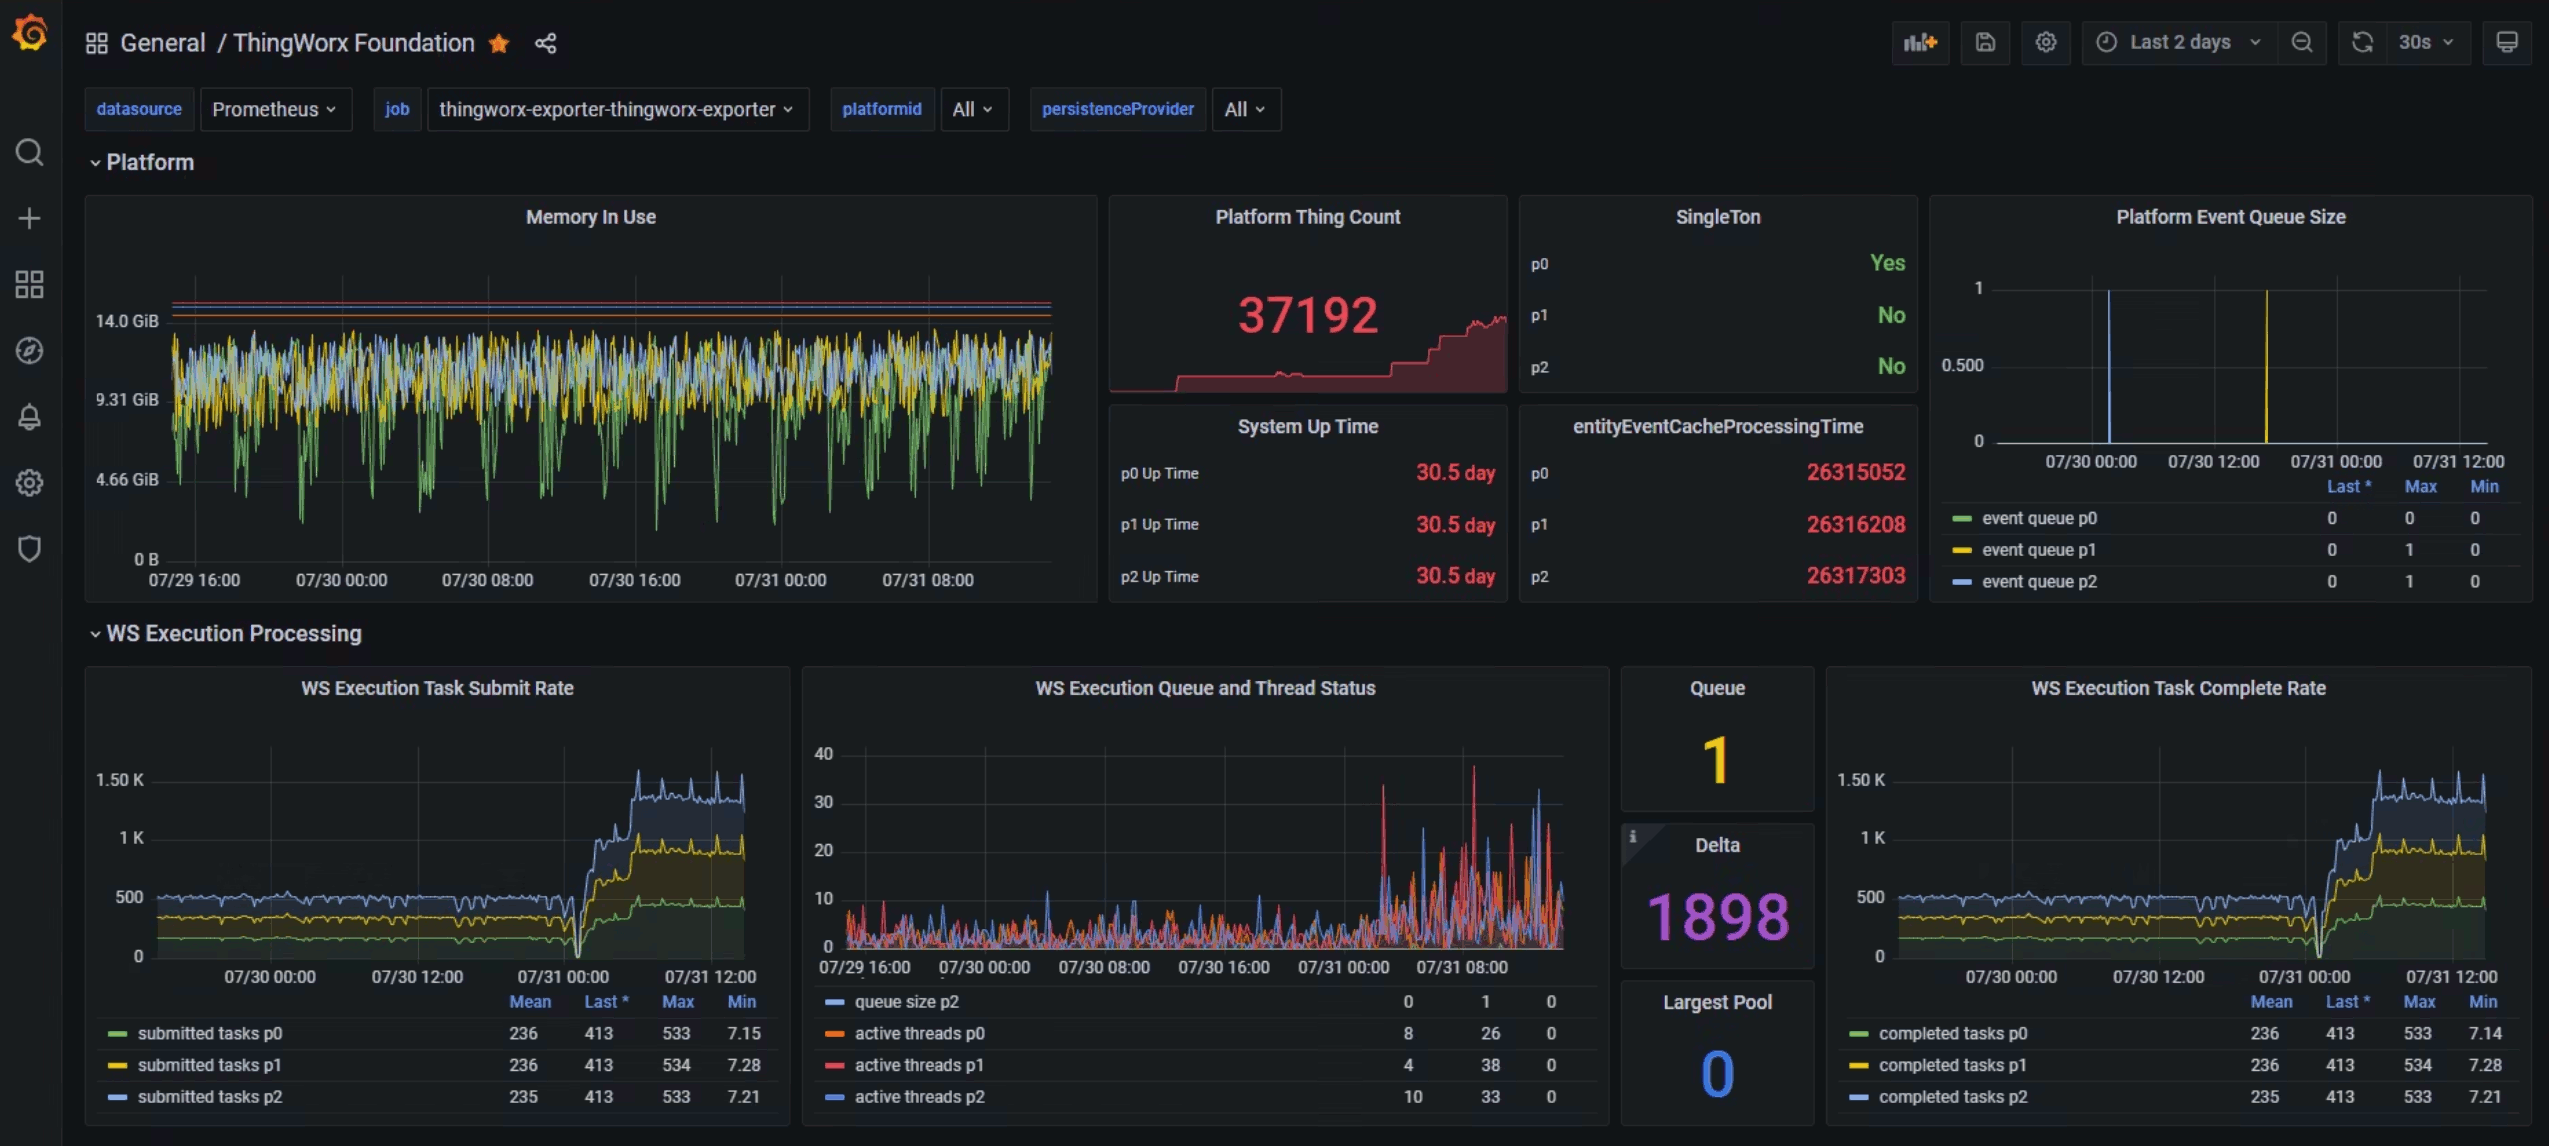
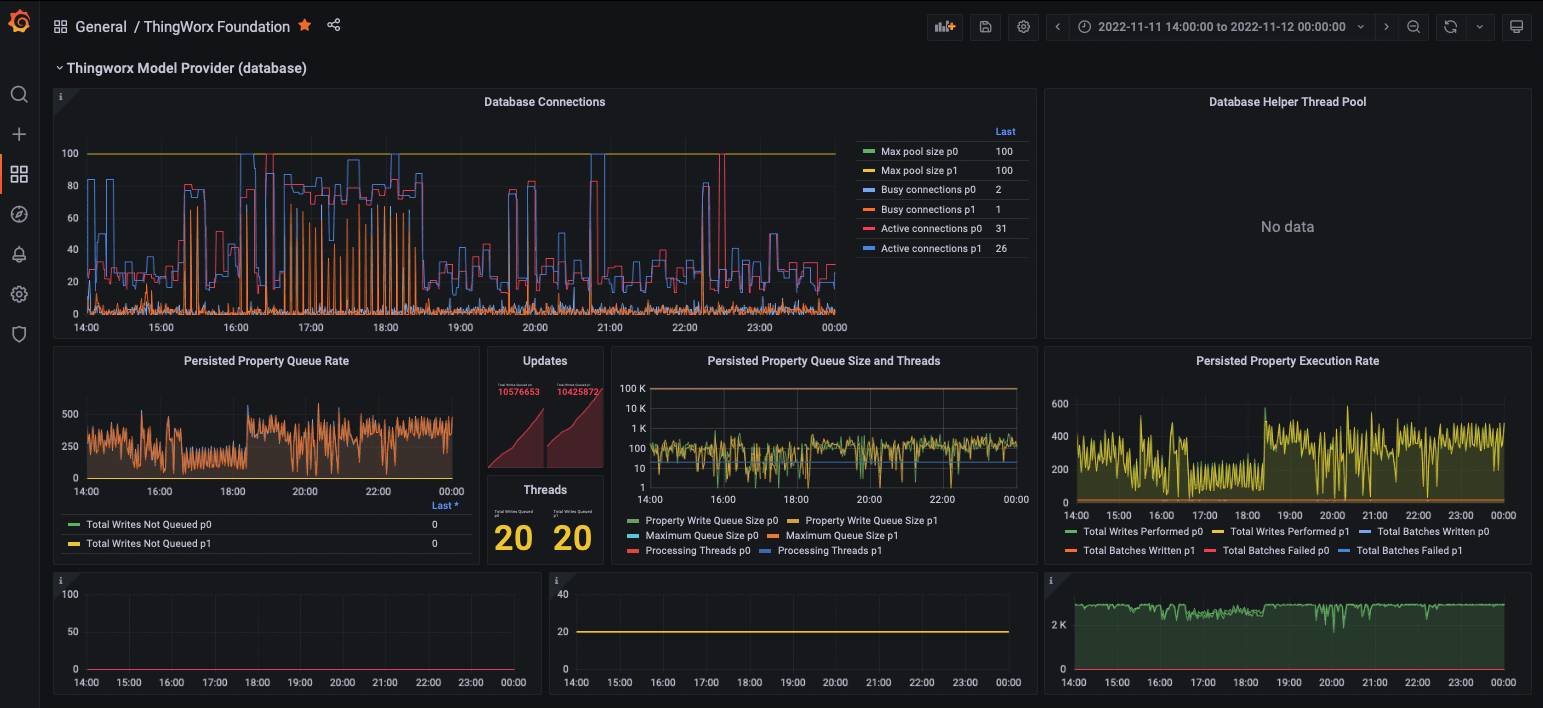
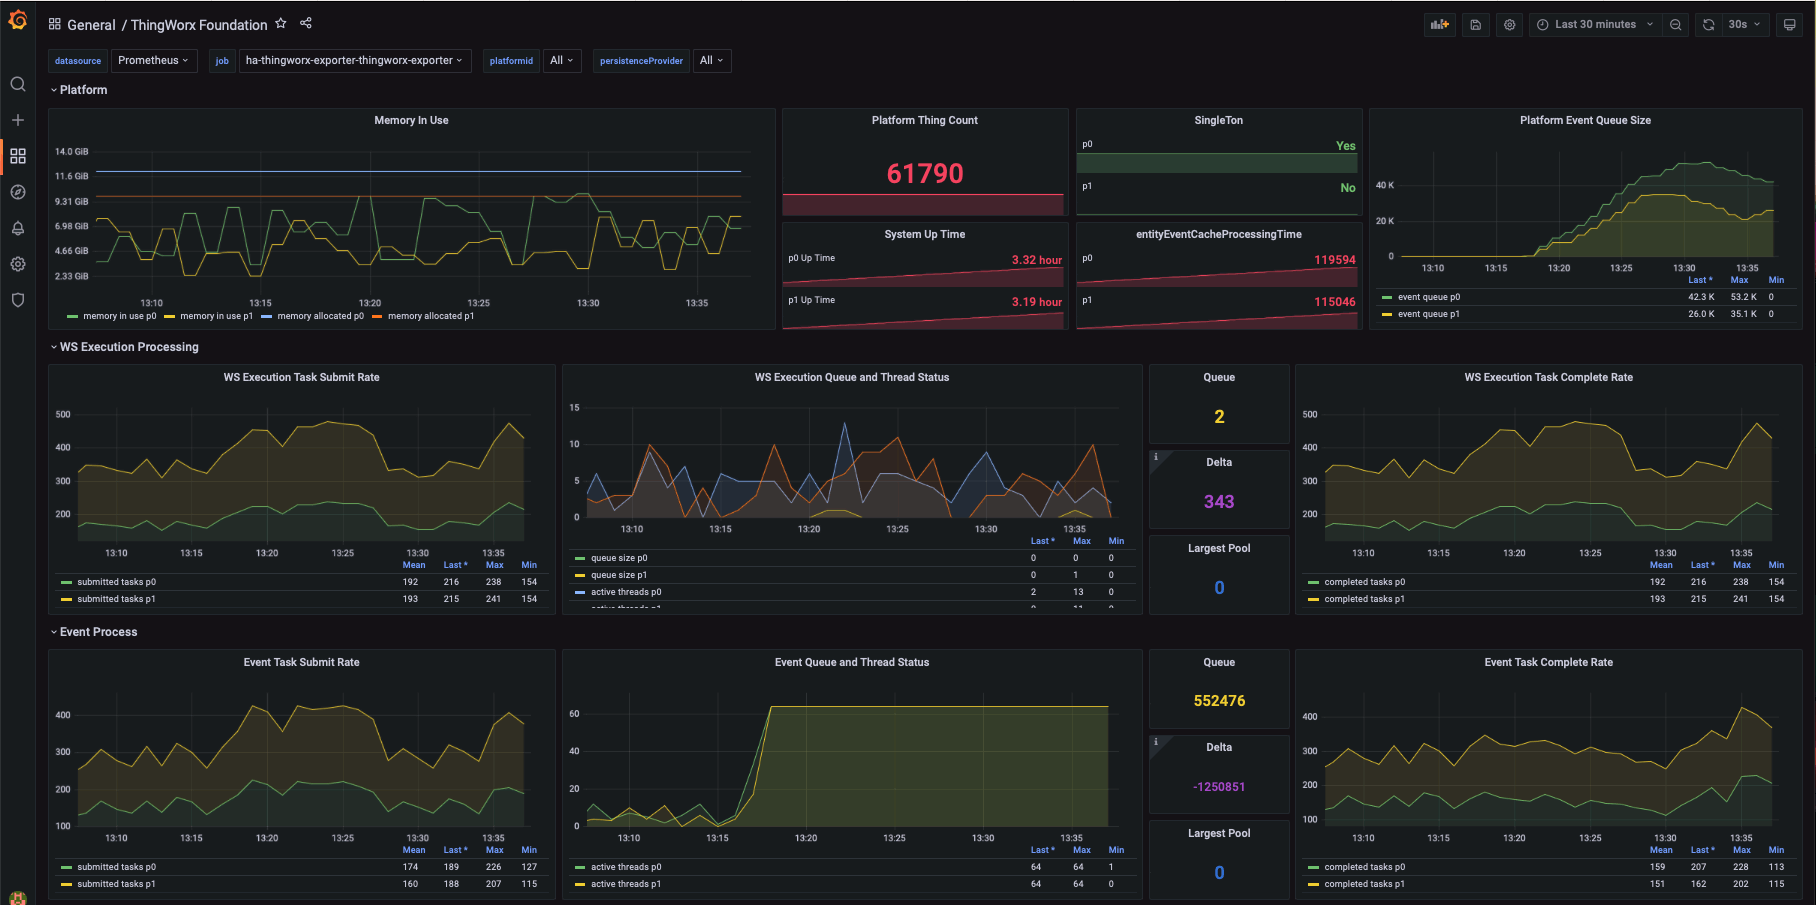
ThingWorx Foundation
ThingWorx Foundation detailed analysis dashboard version 3.0 Please consult [ThingWorx Health and Performance Monitoring - Overview Guide](https://drive.google.com/file/d/1WCXHdI_IMAYkJOdxSJTRZlRHxINvDE0r/view?usp=grafana-dashboard) for more comprehensive detail and explanation.
The following is the Prometheus configuration which you can use to scrape metrics from ThingWorx.
This configuration leverages the default HTTP transport from the private network. You need to change the configuration to use HTTPS if these scrapes will be going across untrusted networks, as otherwise the metrics user credentials could be intercepted.
scrape_configs:
  - job_name: 'Thingworx'
    metrics_path: /Thingworx/Metrics
# scheme: https
    basic_auth:
      username: MetricsUser
      password: not-your-password-dude
    static_configs:
    - targets: ['wer-twx-foundation:8080','server1.dmag.field.devops.ptc.io:8080']
      labels:
        group: Thingworx
    metric_relabel_configs:
    - source_labels: [ __name__ ]
      regex: '(thingworx_General___PTC_Reported_AzureIoT|thingworx_LicensingSubsystem_.*_CHECK_).*'
      action: drop
The RegEx for relabelling is a little trick to drop unneeded metrics. Considering the nearly 300 metrics collected on each scrape, you should be selective on which ones you need to keep if you are storing or forwarding metrics for long-term retention as the volumes will build up and slow your queries.
You'll note the YAML list which allows adding multiple servers to scrape. You can break these out across multiple lines if you wish to apply specific application or other labels as a part of the scrape. Example:
    - targets:
      - simulator.japaneast.cloudapp.azure.com:9100
      labels:
        group: Simulators
        region: Japan
    - targets:
      - simulator.centralus.cloudapp.azure.com:9100
      labels:
        group: Simulators
        region: USA
    - targets:
      - simulator.germanywestcentral.cloudapp.azure.com:9100
      labels:
        group: Simulators
        region: Germany
    - targets:
      - simulator.koreacentral.cloudapp.azure.com:9100
      labels:
        group: Simulators
        region: Korea
The following JMX Exporter configuration adds JVM and Tomcat monitoring to ThingWorx, as well as the DB connection pools and metrics not available as standard.
# Configuration by Greg Eva (geva@ptc.com) - please contact for questions or suggested changes/enhancements
lowercaseOutputLabelNames: false
lowercaseOutputName: true
# Eventually could put back whitelist, however are very specifically pulling only relevant attributes anyway
#whitelistObjectNames: ["java.lang:type=OperatingSystem", "java.lang:type=Memory", "java.lang:type=MemoryPool", "java.lang:type=Threading", "java.lang:type=GarbageCollector", "Catalina:*", "com.mchange.v2.c3p0:*" , "org.apache.commons.pool2:*"]
#blacklistObjectNames: []
rules:
JAVA VIRTUAL MACHINE
-
pattern: 'java.lang<type=OperatingSystem><>(ProcessCpuLoad|SystemCpuLoad|SystemLoadAverage|AvailableProcessors):'
name: jvm_processor_$1
help: Java Virtual Machine processor load for $1
type: GAUGE
-
pattern: 'java.lang<type=OperatingSystem><>(\w+)FileDescriptorCount:'
name: jvm_filedescriptor_$1_count
help: Java Virtual Machine open and maximum file descriptors
type: GAUGE
-
pattern: 'java.lang<type=OperatingSystem><>(TotalSwapSpace|FreeSwapSpace|TotalPhysicalMemorySize|FreePhysicalMemorySize):'
name: jvm_memory_$1_bytes
help: Java Virtual Machine memory for $1
type: GAUGE
-
pattern: 'java.lang<type=Threading><>(CurrentThreadCpuTime|CurrentThreadUserTime):'
name: jvm_threads_$1_total
help: Java Virtual Machine threads for $1
type: COUNTER
-
pattern: 'java.lang<type=Memory><(\w+)MemoryUsage>(\w+): (\d+)'
name: jvm_memory_bytes_$2
labels:
area: "$1" # Heap/NonHeap
value: $3
type: GAUGE
Skipping GC related metrics, as they come in with the Java agent exporter implementation (not HTTP server)
Ideally I would like these two metrics, but I cannot get the JMX query to work
LastGcInfo before and after memory details not needed as present on jvm_memory_pool_allocated_bytes_total
#- pattern: 'java.lang<name=([-a-zA-Z0-9+/$%~_-|!.]*),type=GarbageCollector><LastGcInfo>(GcThreadCount|duration)'
name: jvm_gc_$2
labels:
pool: $1
help: Java Virtual Machine garbage collection for $1
type: GAUGE
TOMCAT
-
pattern: 'Catalina<type=GlobalRequestProcessor, name="(\w+-.+?)-(\d+)"><>(\w+):'
name: tomcat_$3_total
labels:
port: "$2"
protocol: "$1"
help: Tomcat global $3
type: COUNTER
-
pattern: 'Catalina<type=GlobalRequestProcessor, Upgrade=([-a-zA-Z0-9+/$%~-|!.]*), name="(\w+-.+?)-(\d+)"><>(\w+):'
name: tomcat_upgrade$4_total
labels:
port: "$2"
protocol: "$1"
upgrade: "$3"
help: Tomcat global $4
type: COUNTER
-
pattern: 'Catalina<j2eeType=Servlet, WebModule=//([-a-zA-Z0-9+&@#/%?=_|!:.,;]*[-a-zA-Z0-9+&@#/%=|]), name=([-a-zA-Z0-9+/$%~-|!.]*), J2EEApplication=none, J2EEServer=none><>(requestCount|maxTime|processingTime|errorCount):'
name: tomcat_servlet_$3_total
labels:
module: "$1"
servlet: "$2"
help: Tomcat servlet $3 total
type: COUNTER
-
pattern: 'Catalina<type=ThreadPool, name="(\w+-.+?)-(\d+)"><>(currentThreadCount|currentThreadsBusy|keepAliveCount|maxKeepAliveRequests|pollerThreadCount|connectionCount|maxConnections|connectionTimeout|maxThreads|minSpareThreads|acceptCount|acceptorThreadCount):'
name: tomcat_threadpool_$3
labels:
port: "$2"
protocol: "$1"
help: Tomcat threadpool $3
type: GAUGE
-
pattern: 'Catalina<type=Manager, host=([-a-zA-Z0-9+&@#/%?=_|!:.,;]*[-a-zA-Z0-9+&@#/%=|]), context=([-a-zA-Z0-9+/$%~-|!.]*)><>(processingTime|sessionCounter|rejectedSessions|expiredSessions):'
(Catalina<j2eeType=Servlet, WebModule=//localhost/examples, name=stock, J2EEApplication=none, J2EEServer=none><>asyncSupported)
name: tomcat_session_$3_total
labels:
context: "$2"
host: "$1"
help: Tomcat session $3 total
type: COUNTER
-
pattern: 'Catalina<type=WebResourceRoot, host=([-a-zA-Z0-9+&@#/%?=_|!:.,;]*[-a-zA-Z0-9+&@#/%=|]), context=([-a-zA-Z0-9+/$%~-|!.]*), name=Cache><>(\w+):'
name: tomcat_cache_$3
labels:
context: "$2"
host: "$1"
help: Tomcat Resource cache confirguration and performance metrics (units are kb and ms)
type: GAUGE
C3P0 (ThingWorx Database Connection Library)
-
pattern: 'com.mchange.v2.c3p0<type=PooledDataSource, identityToken=([-a-zA-Z0-9+/$%_-|!.]*), name=([-a-zA-Z0-9+/$%-|!.]*)><>(numFailedIdleTestsDefaultUser|numFailedIdleTestsAllUsers):'
name: thingworx_PersistenceProvider$3_total
labels:
pool: $2
help: ThingWorx Persistence Provider DB Connection Pool performance metrics (C3P0)
type: COUNTER
-
pattern: 'com.mchange.v2.c3p0<type=PooledDataSource, identityToken=([-a-zA-Z0-9+/$%_-|!.]*), name=([-a-zA-Z0-9+/$%-|!.]*)><>(maxPoolSize|numBusyConnections|numBusyConnectionsAllUsers|numBusyConnectionsDefaultUser|numConnections|numConnectionsAllUsers|numConnectionsDefaultUser|numIdleConnections|numIdleConnectionsAllUsers|numIdleConnectionsDefaultUser|threadPoolNumActiveThreads|threadPoolNumIdleThreads|threadPoolNumTasksPending|threadPoolSize|unreturnedConnectionTimeout|statementCacheNumCheckedOutDefaultUser|statementCacheNumCheckedOutStatementsAllUsers|statementCacheNumConnectionsWithCachedStatementsAllUsers|statementCacheNumConnectionsWithCachedStatementsDefaultUser|numDeferredCloseThreads|statementCacheNumStatementsAllUsers|statementCacheNumStatementsDefaultUser):'
name: thingworx_PersistenceProvider$3
labels:
pool: $2
help: ThingWorx Persistence Provider DB Connection Pool performance metrics (C3P0)
type: GAUGE
DBCP2/POOL2 (Thingworx Database Thing Template)
-
pattern: 'org.apache.commons.pool2<type=GenericObjectPool, name=([-a-zA-Z0-9+/$%~-|!.]*)><>(BorrowedCount|CreatedCount|DestroyedCount|ReturnedCount):'
name: thingworx_DatabaseThing$2_total
labels:
pool: $1
type: COUNTER
help: ThingWorx Database Thing DB Connection Pool performance metrics (Apache Pool2/DBCP2)
-
pattern: 'org.apache.commons.pool2<type=GenericObjectPool, name=([-a-zA-Z0-9+/$%~-|!.]*)><>(MaxIdle|MaxTotal|MaxWaitMillis|MeanActiveTimeMillis|MeanBorrowWaitTimeMillis|MeanIdleTimeMillis|MinEvictableIdleTimeMillis|MinIdle|NumActive|NumIdle|NumWaiters)'
name: thingworx_DatabaseThing$2
labels:
pool: $1
type: GAUGE
help: ThingWorx Database Thing DB Connection Pool performance metrics (Apache Pool2/DBCP2)
For everything missing… compatibility across MSAI deployments and my own dashboards.
#- pattern: "java.*"
- pattern: "Catalina*"
You will then need to either change your Tomcat service to include the JMX Exporter as a Java agent, or add it to the JAVA_OPTS or CATALINA_OPTS so that the exporter with associated configuration file will be loaded with Tomcat.
-javaagent:/opt/jmx_exporter/jmx_prometheus_javaagent-0.20.0.jar=9111:/opt/jmx_exporter/jmx-exporter-config-twx.yaml
And then add the relevant Prometheus scrape configuration for the above JMX Exporter configuration. Consult the Prometheus documentation should you need to enhance it.
  - job_name: 'jmx'
static_configs:
- targets: ['wer-twx-foundation:9111', 'wer-twx-iothubconnector:9111']
Data source config
Collector config:
Upload an updated version of an exported dashboard.json file from Grafana
| Revision | Description | Created | |
|---|---|---|---|
| Download |