
Fortigate Prometheus Exporter
A Dashboard for the Prometheus fortigate_exporter
Dashboards de Grafana
Dashboard fork from Dashboard ID 14011
Also uses fortigate_exporter made by @bluecmd
This dashboard differs a little from the original mainly changing the old grahp style and adding some customization on the data output (hidding unused interfaces, adding company logo, etc)
| Sections | Description |
|---|---|
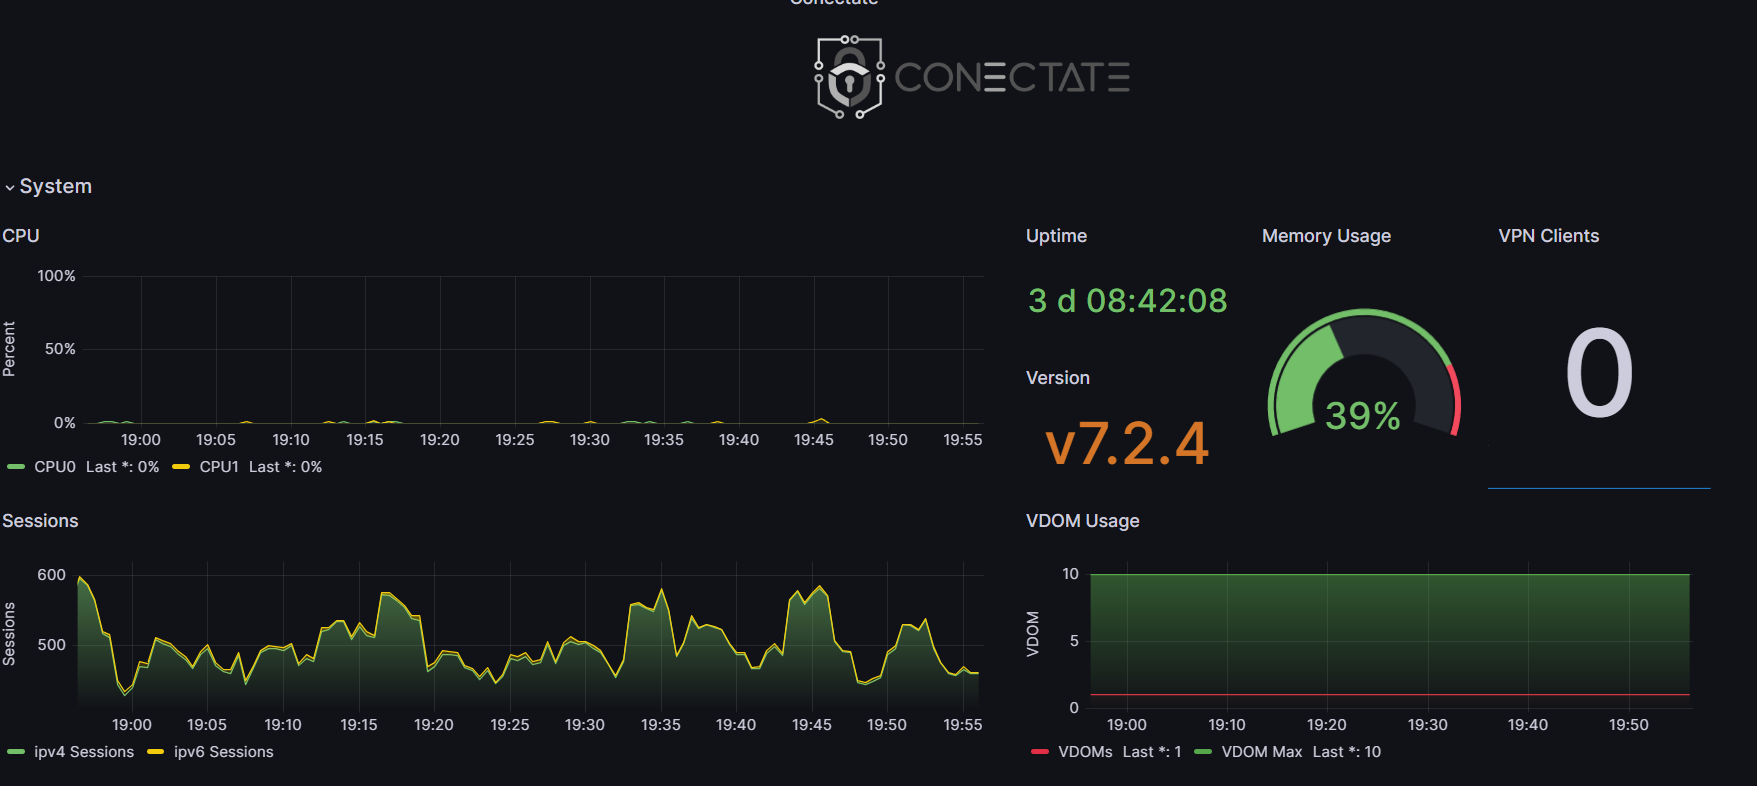
| System | CPU, memory, version, uptime, etc |
| HA Cluster | Information about Fortigate Cluster |
| Interface | Shows connected interfaces and also all interfaces traffic statics (connected and not connected) |
| Policies | Shows information about active sessions, bandwidth, hit count and packets by policy |
| VPN | Client VPN connections, IPSec VPN status, Bandwidth |
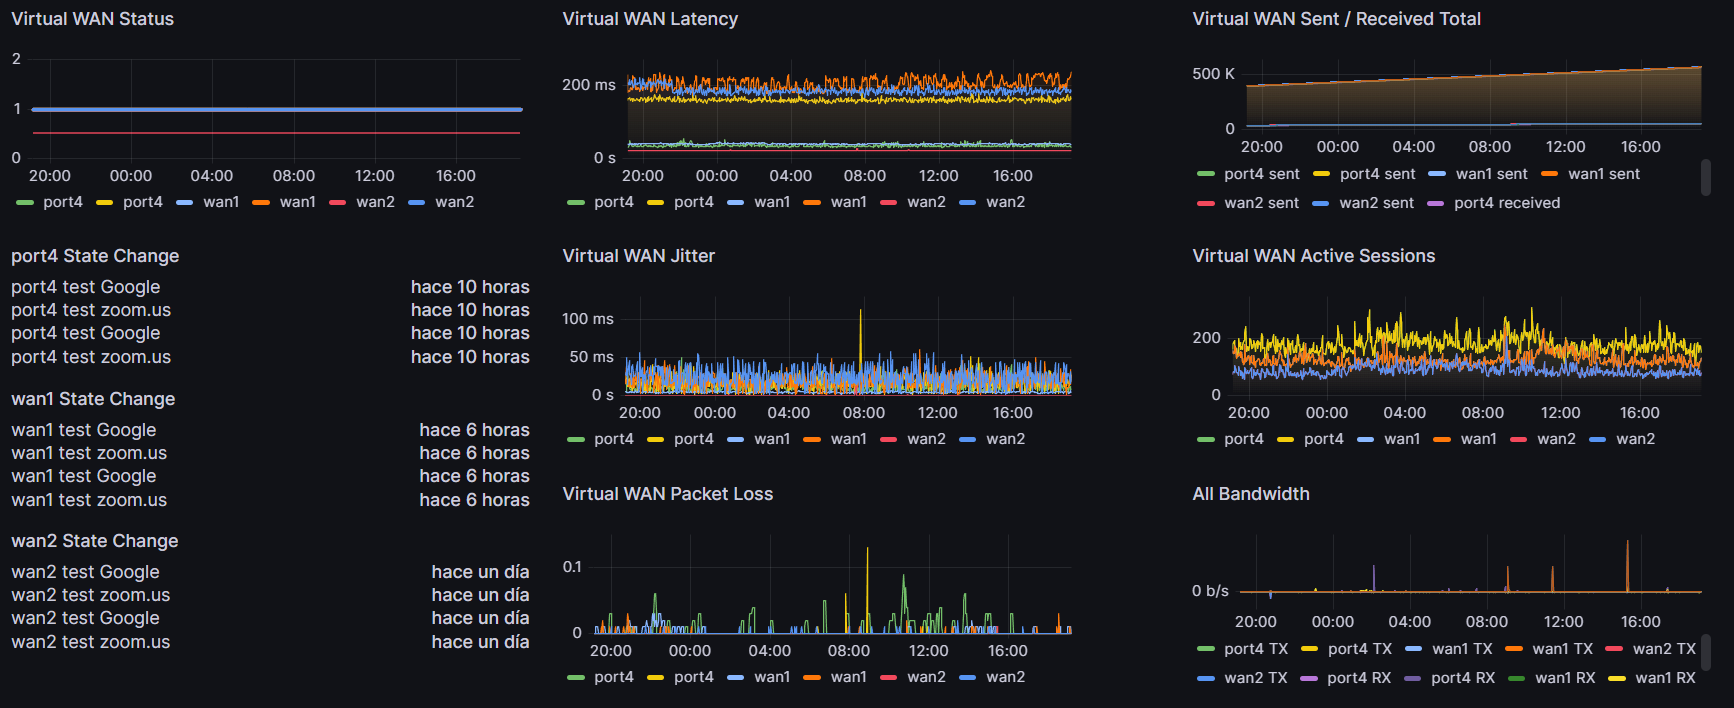
| Link Monitoring | Statics about configured link monitoring like latency, Jitter, Packet Loss, State Change, etc |
| SD WAN | Statics about SD-WAN like links latency, jitter, packet loss, state changes, status, bandwidth, etc |
If you want to fork or improve this dashboard
Find the Dashboard in this repo at /networking/Fortigate Prometheus Exporter.json
Data source config
Collector type:
Collector plugins:
Collector config:
Revisions
Upload an updated version of an exported dashboard.json file from Grafana
| Revision | Description | Created | |
|---|---|---|---|
| Download |
Metrics Endpoint (Prometheus)
Easily monitor any Prometheus-compatible and publicly accessible metrics URL with Grafana Cloud's out-of-the-box monitoring solution.
Learn more