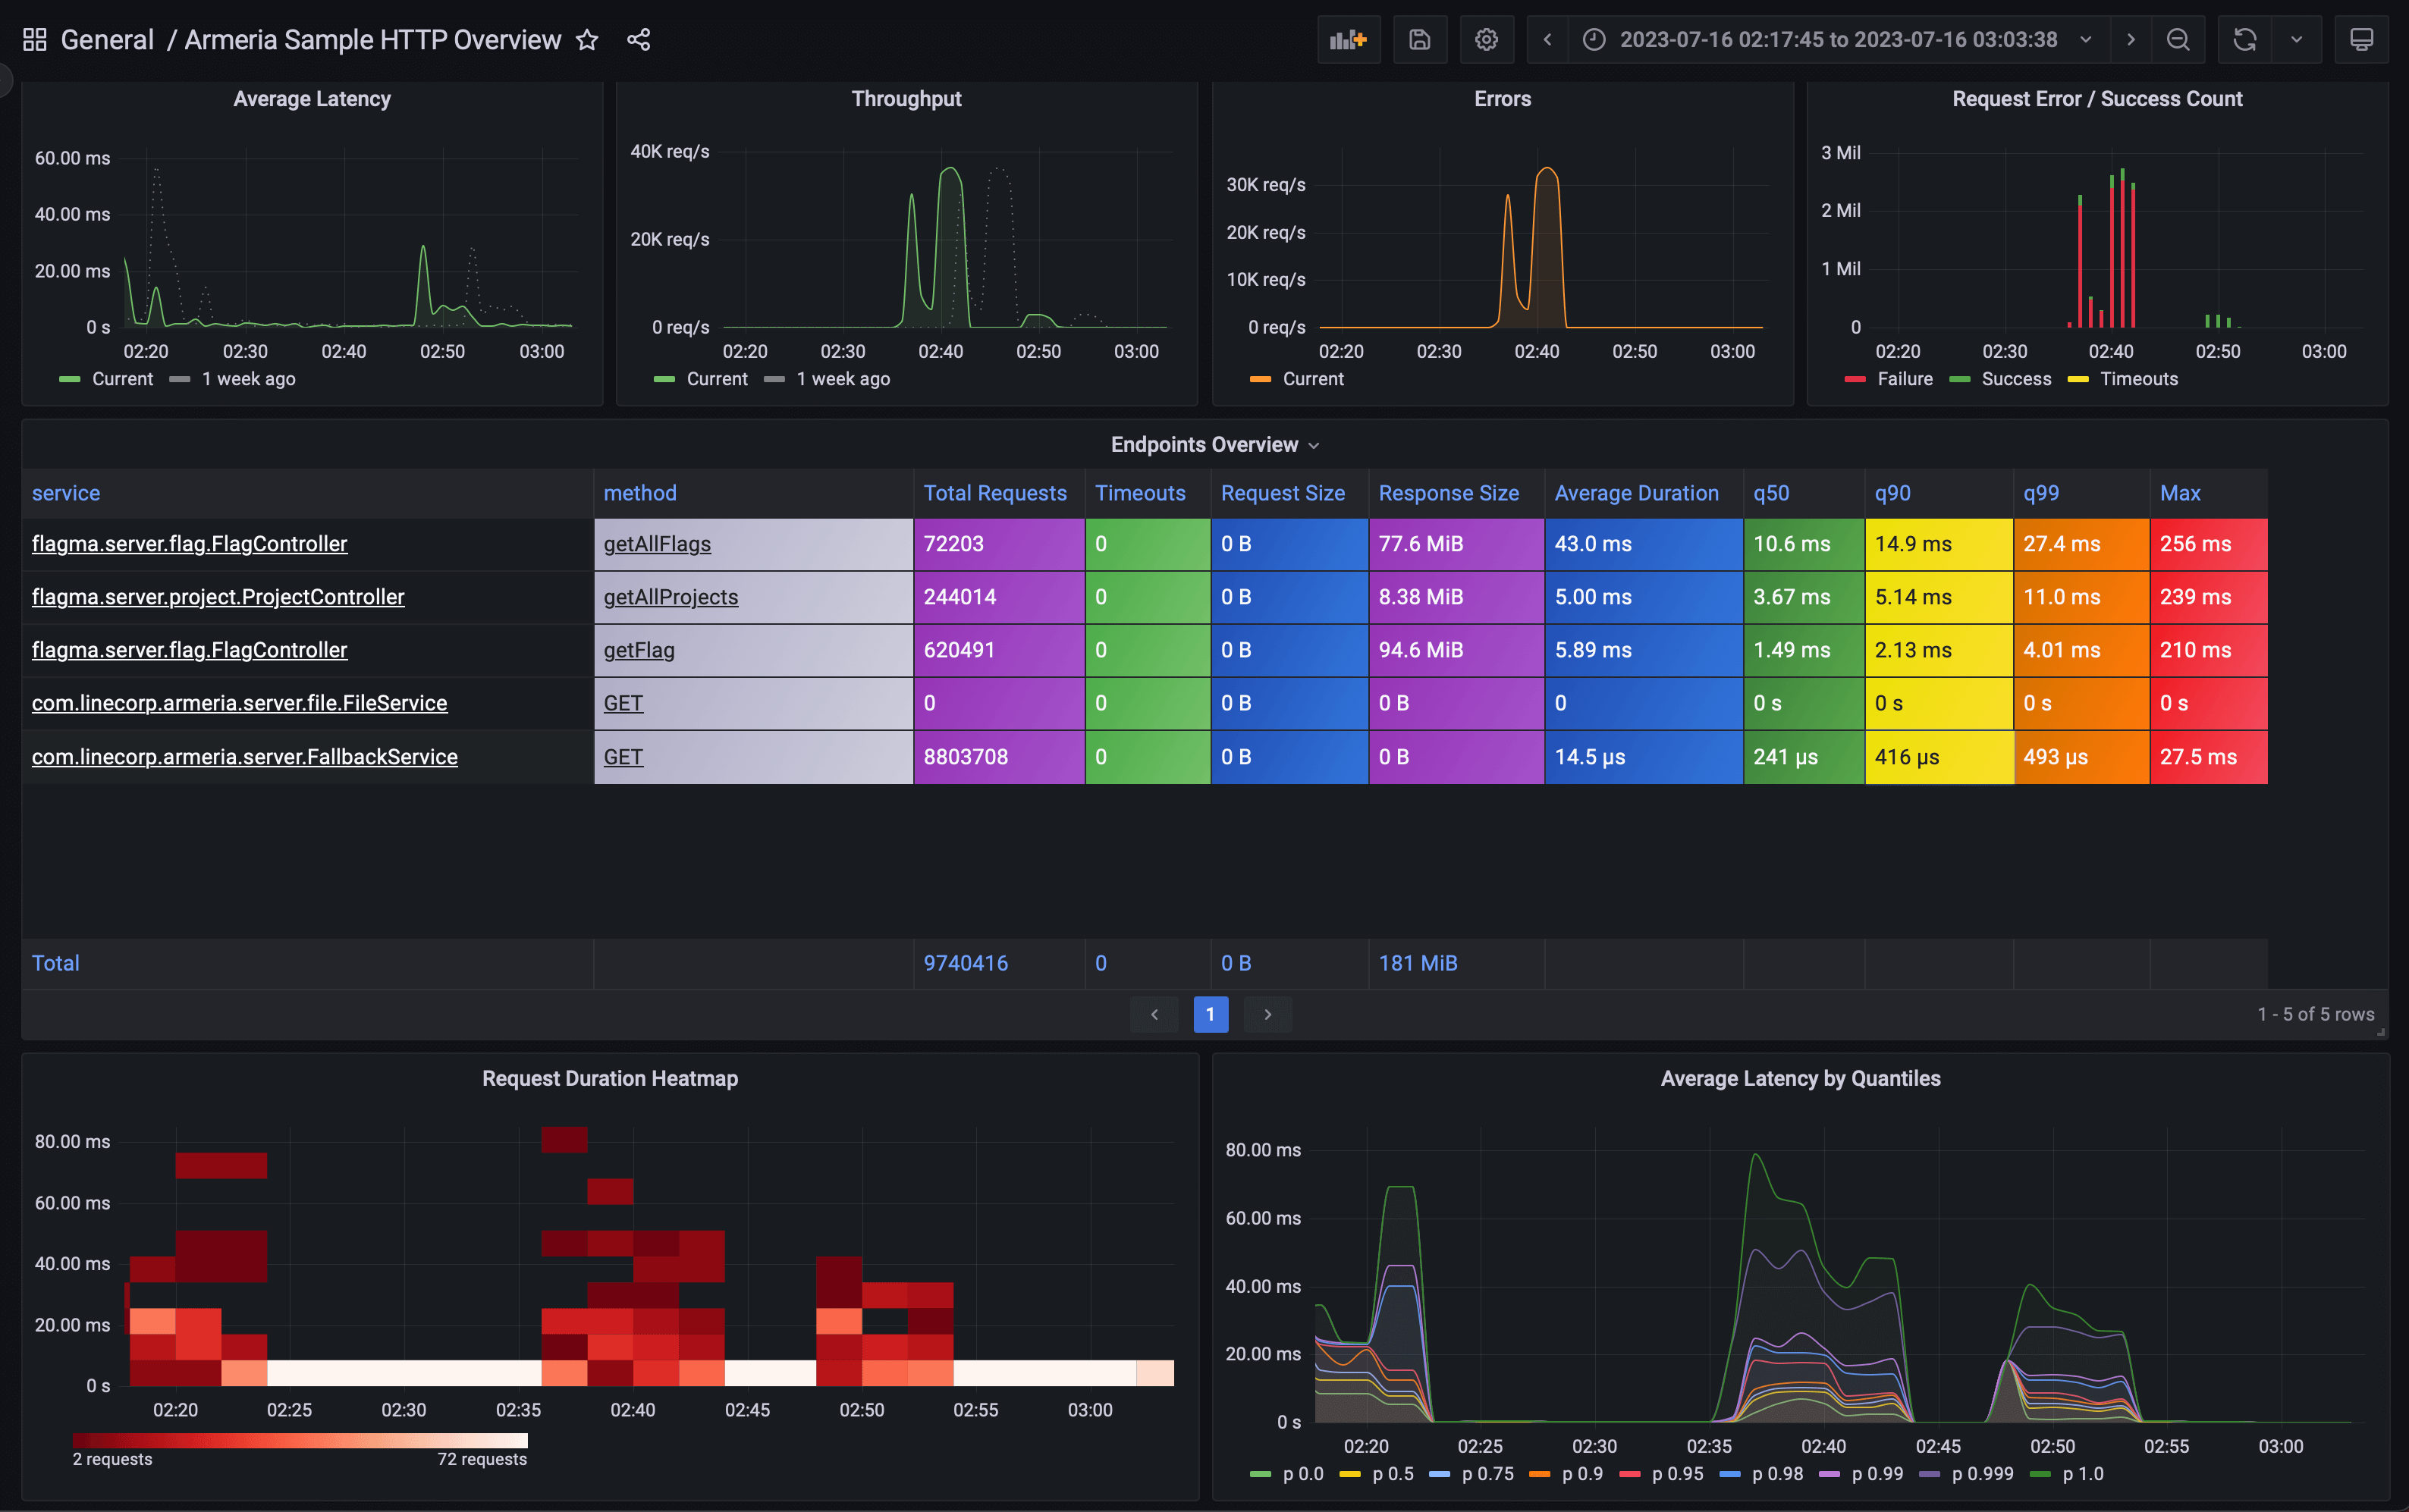
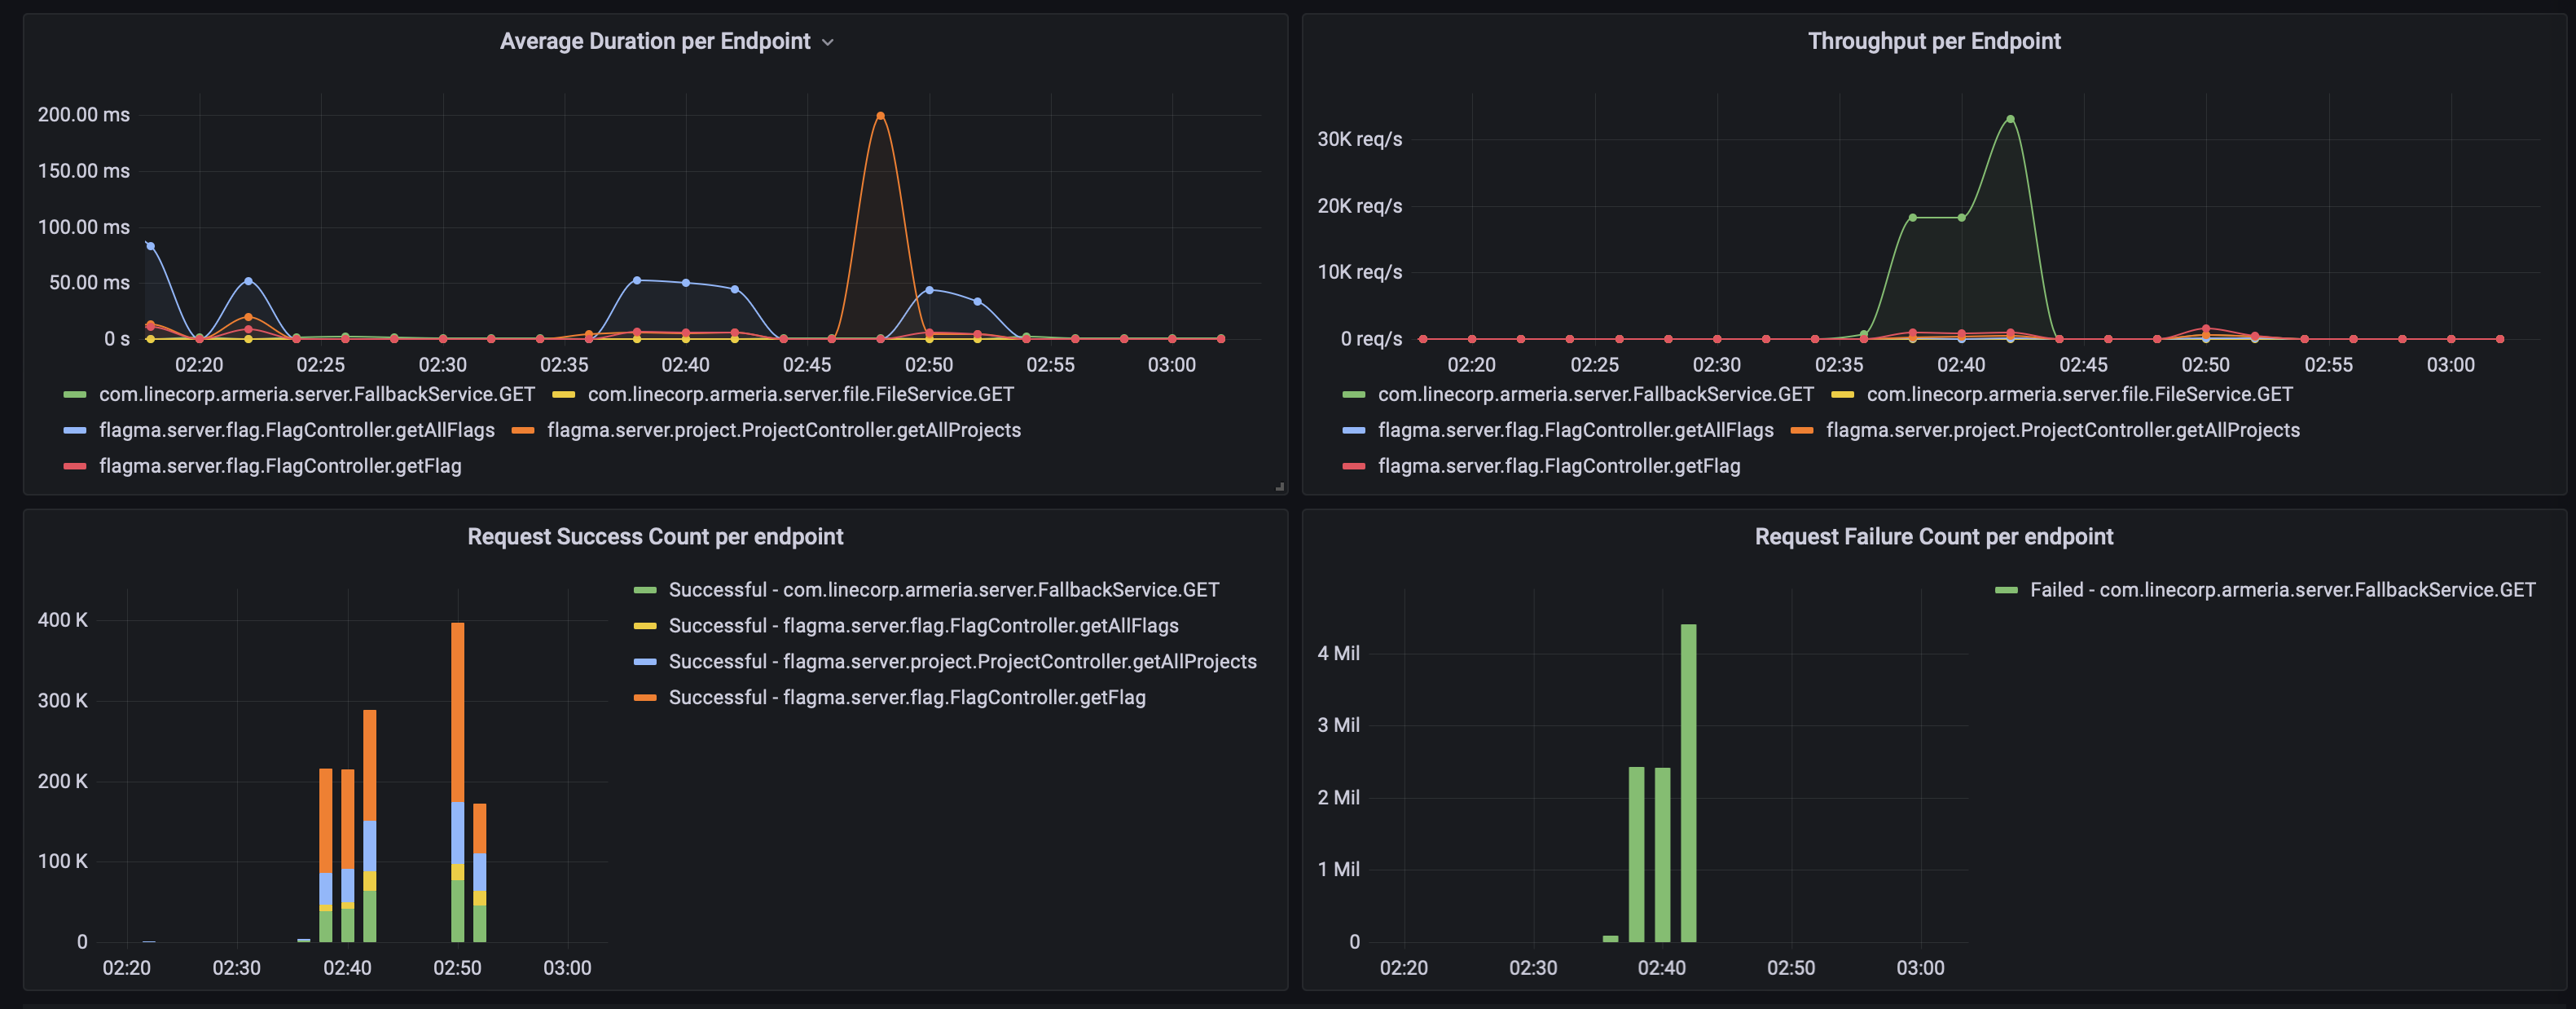
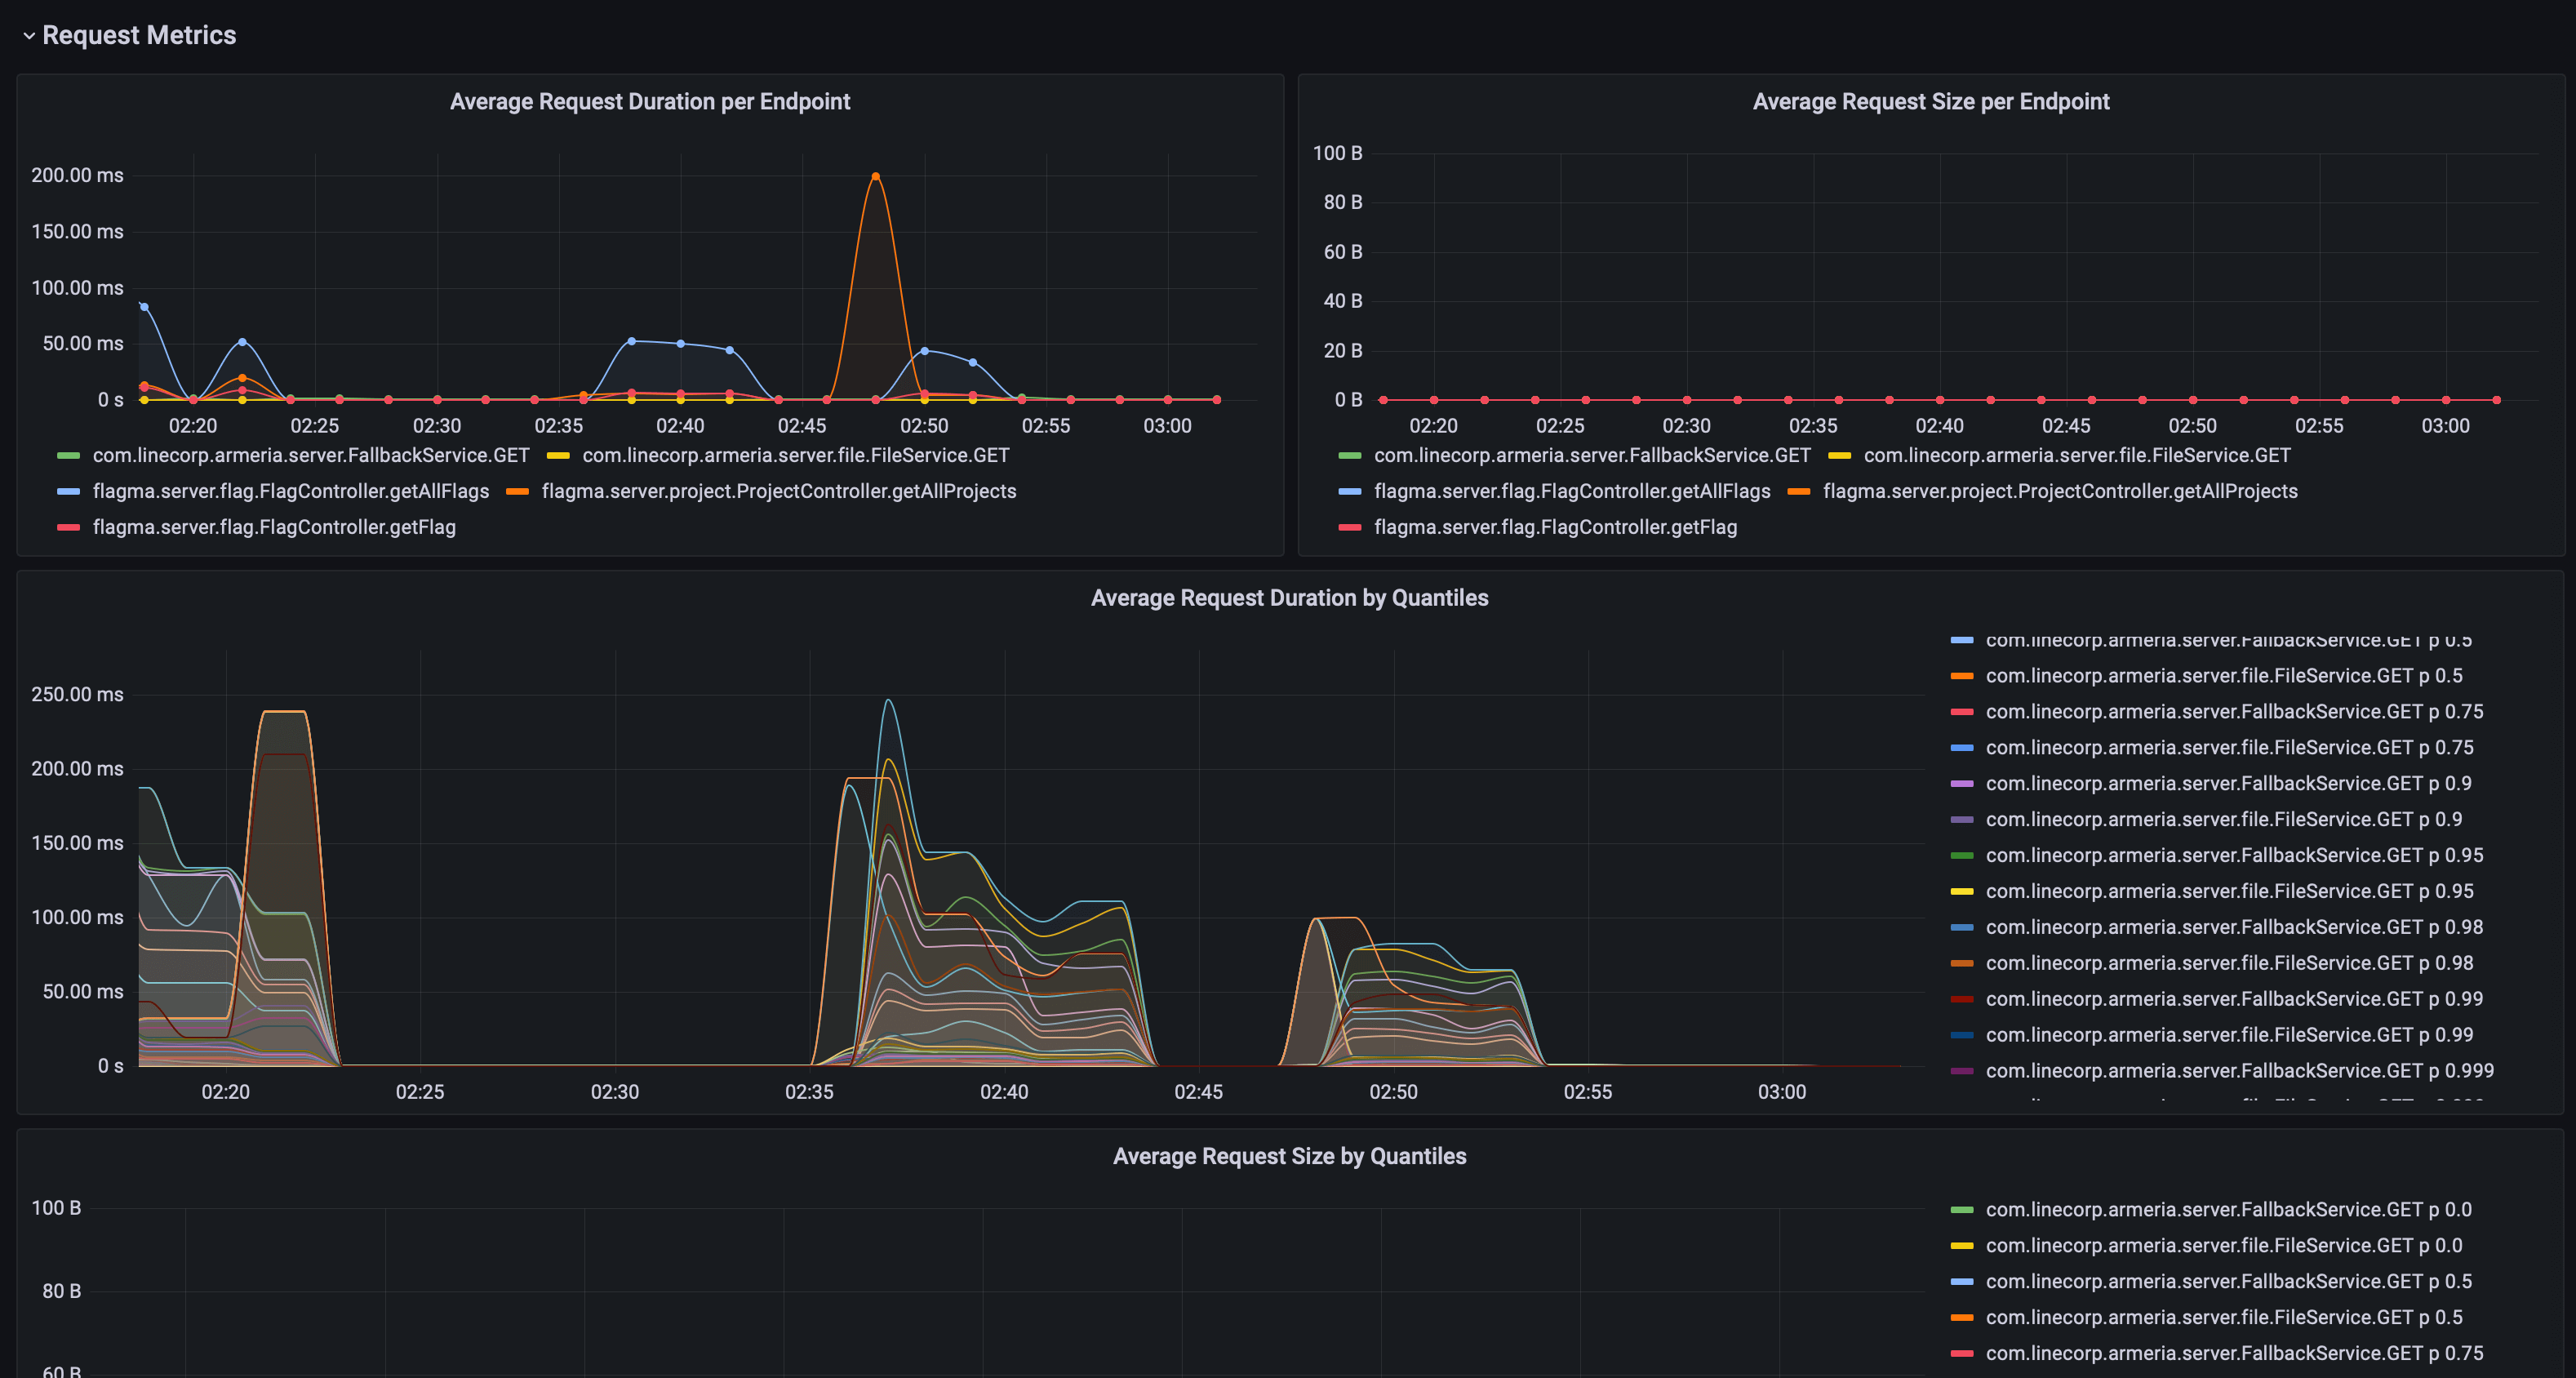
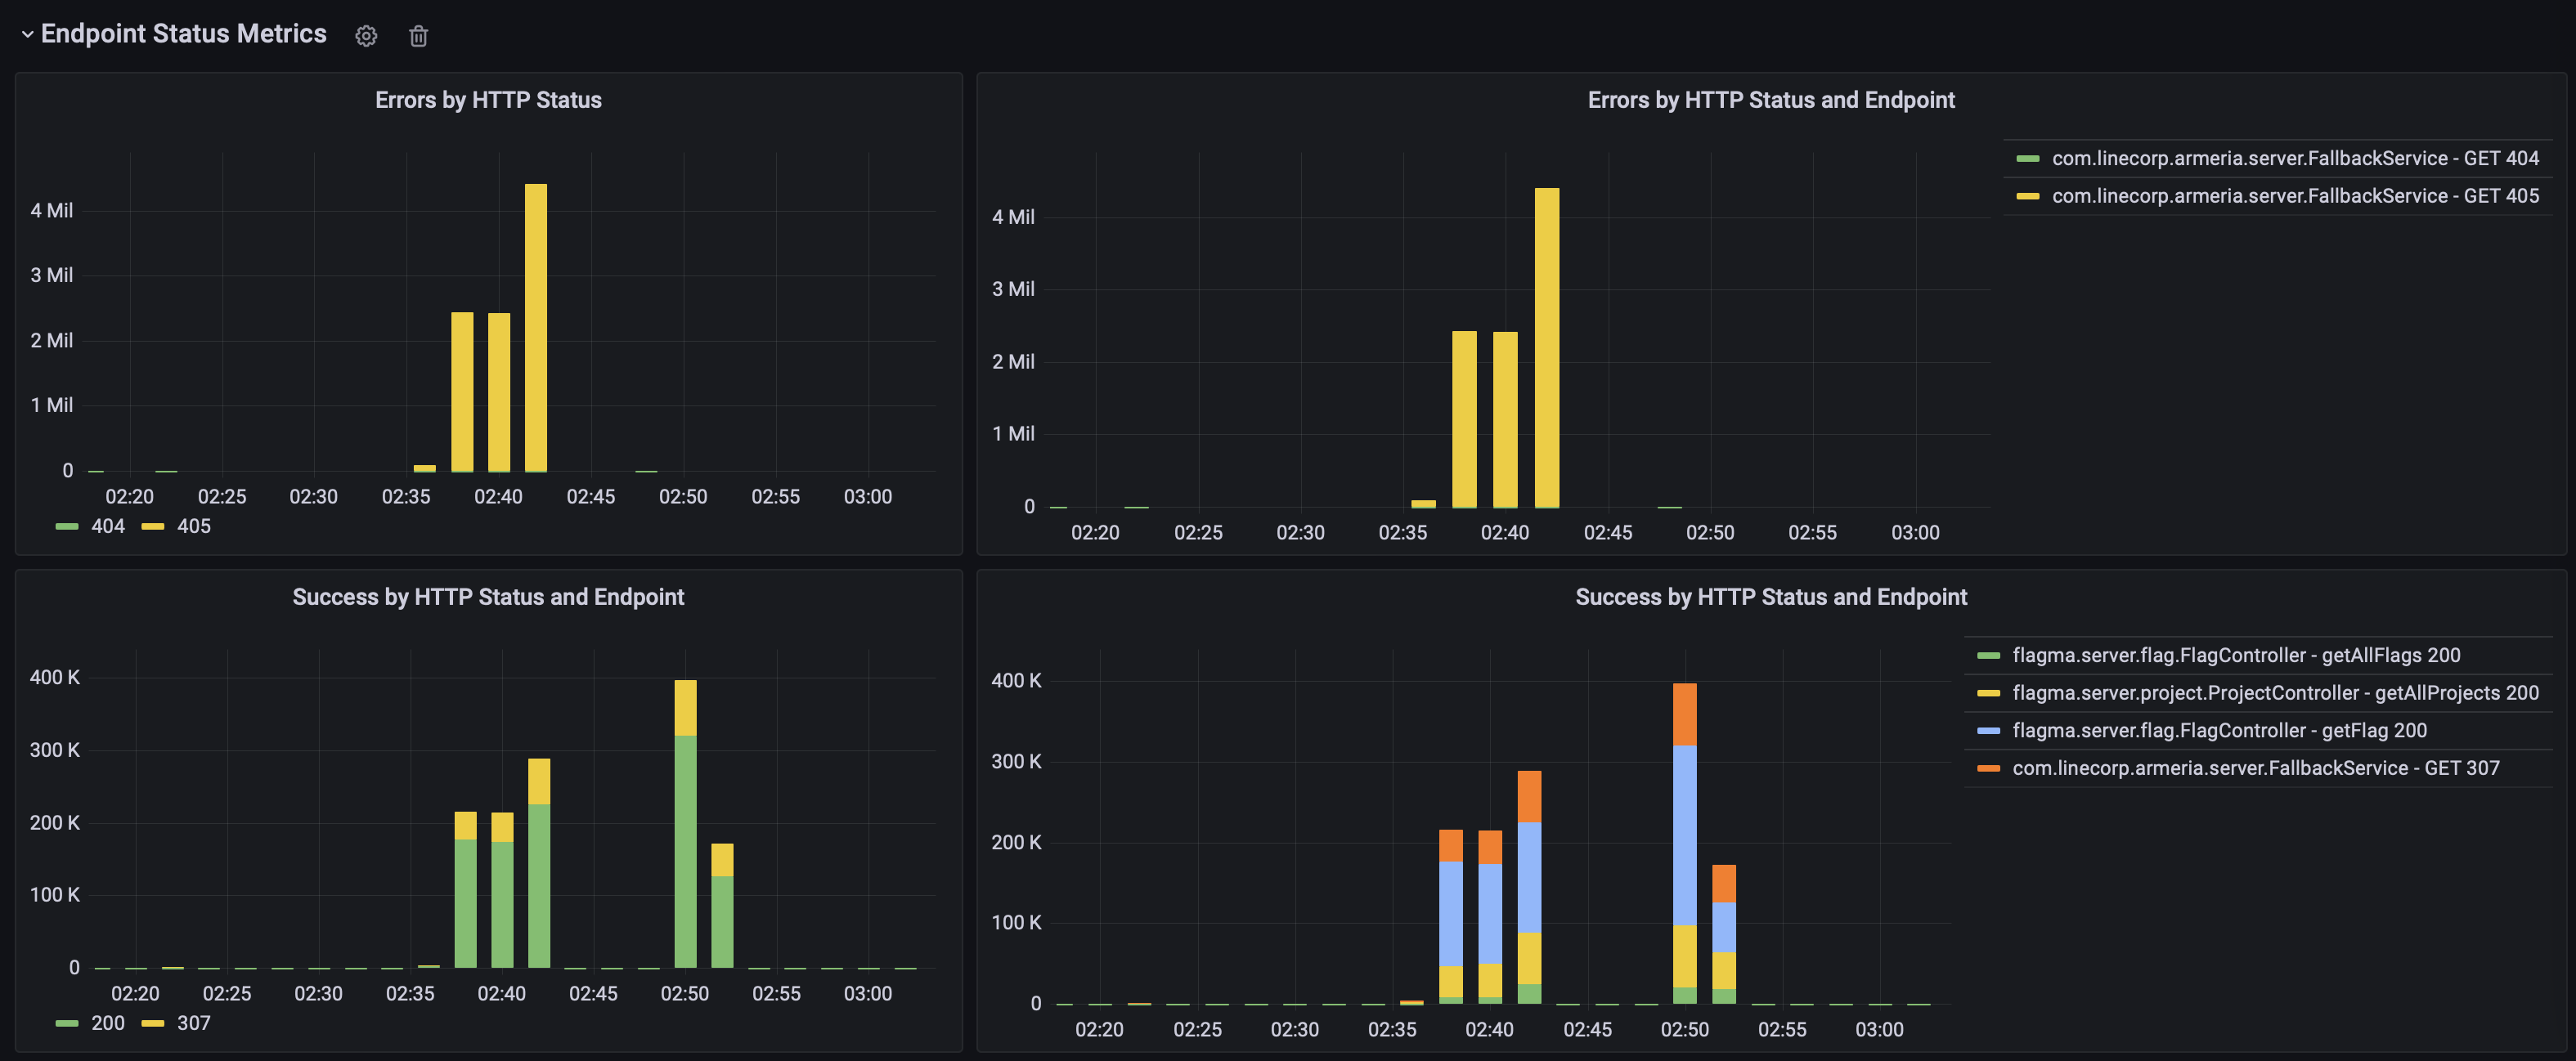
Armeria Server Overview
Overview your Armeria server using the default metrics provided by Armeria framework using Prometheus.
This dashboard uses the default metrics exported by Armeria as described in Collecting Metrics.
By default, MeterIdPrefixFunction.ofDefault("armeria.http.service") prefix function is assumed to be used.
Please also check Armeria Endpoint Statistics dashboard to enable navigation to endpoint statistics by clicking on endpoint names.
For any feedback or issues, please visit Armeria GitHub Page.
Data source config
Collector config:
Upload an updated version of an exported dashboard.json file from Grafana
| Revision | Description | Created | |
|---|---|---|---|
| Download |


