Node Exporter Full
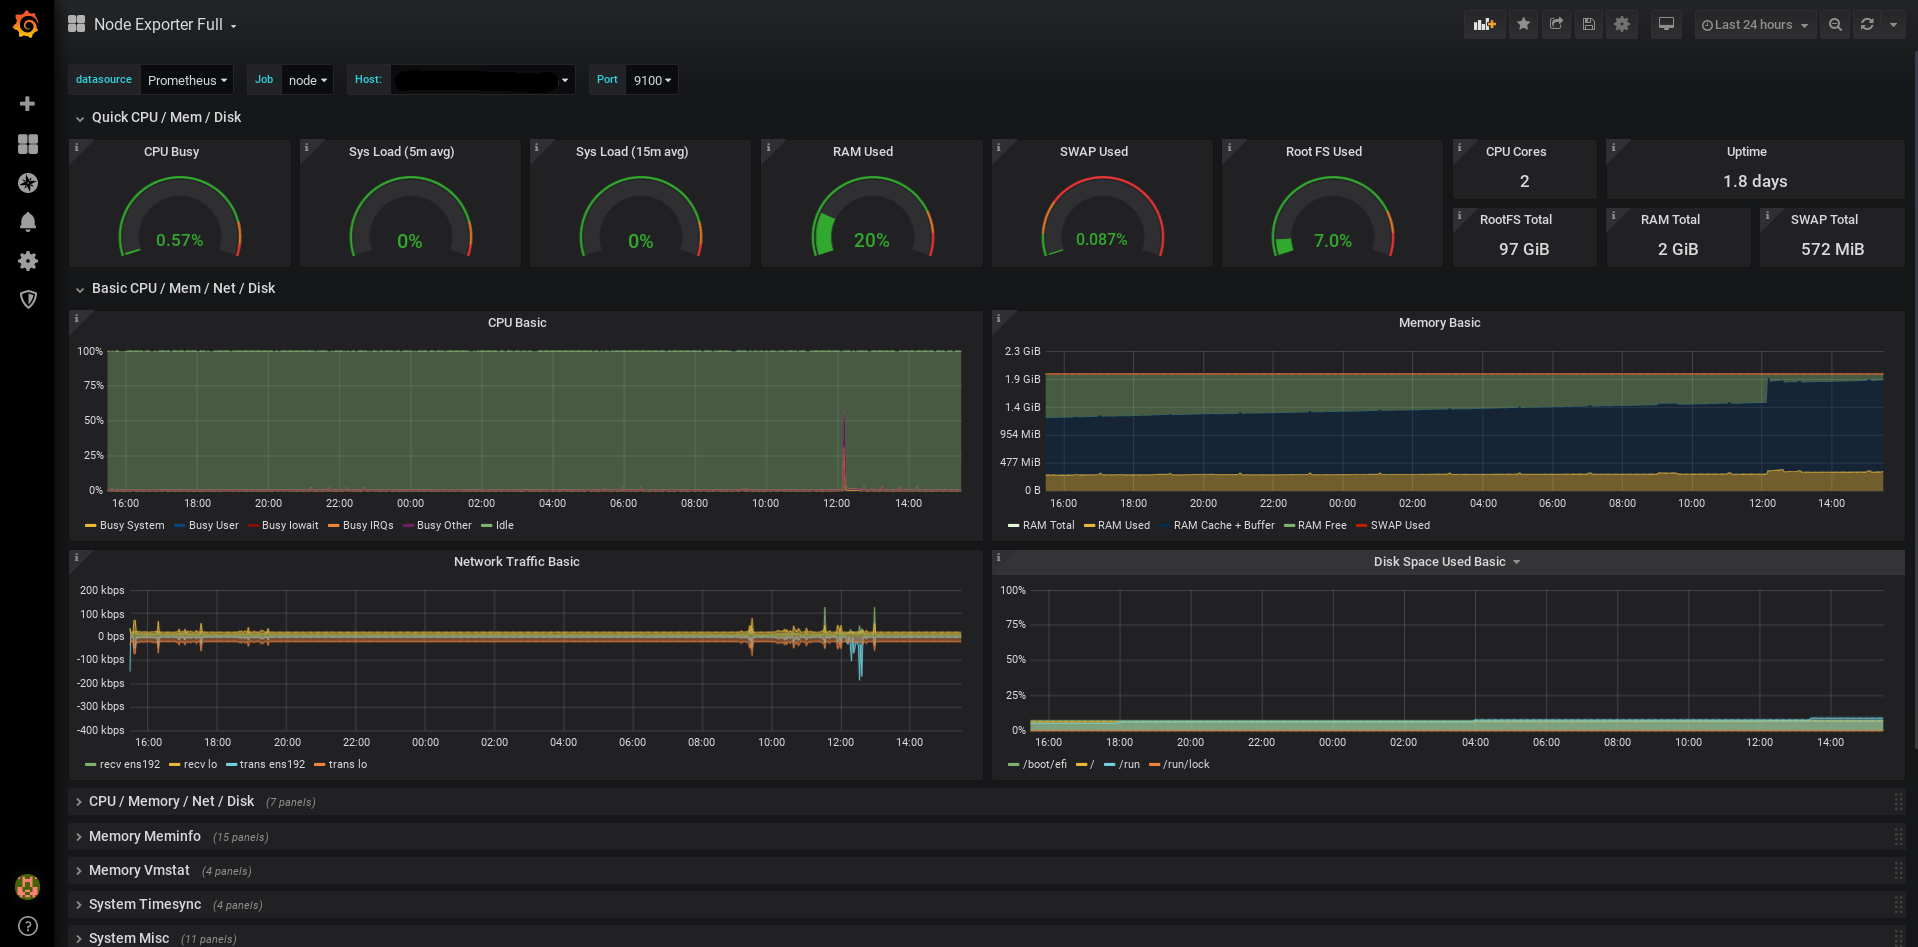
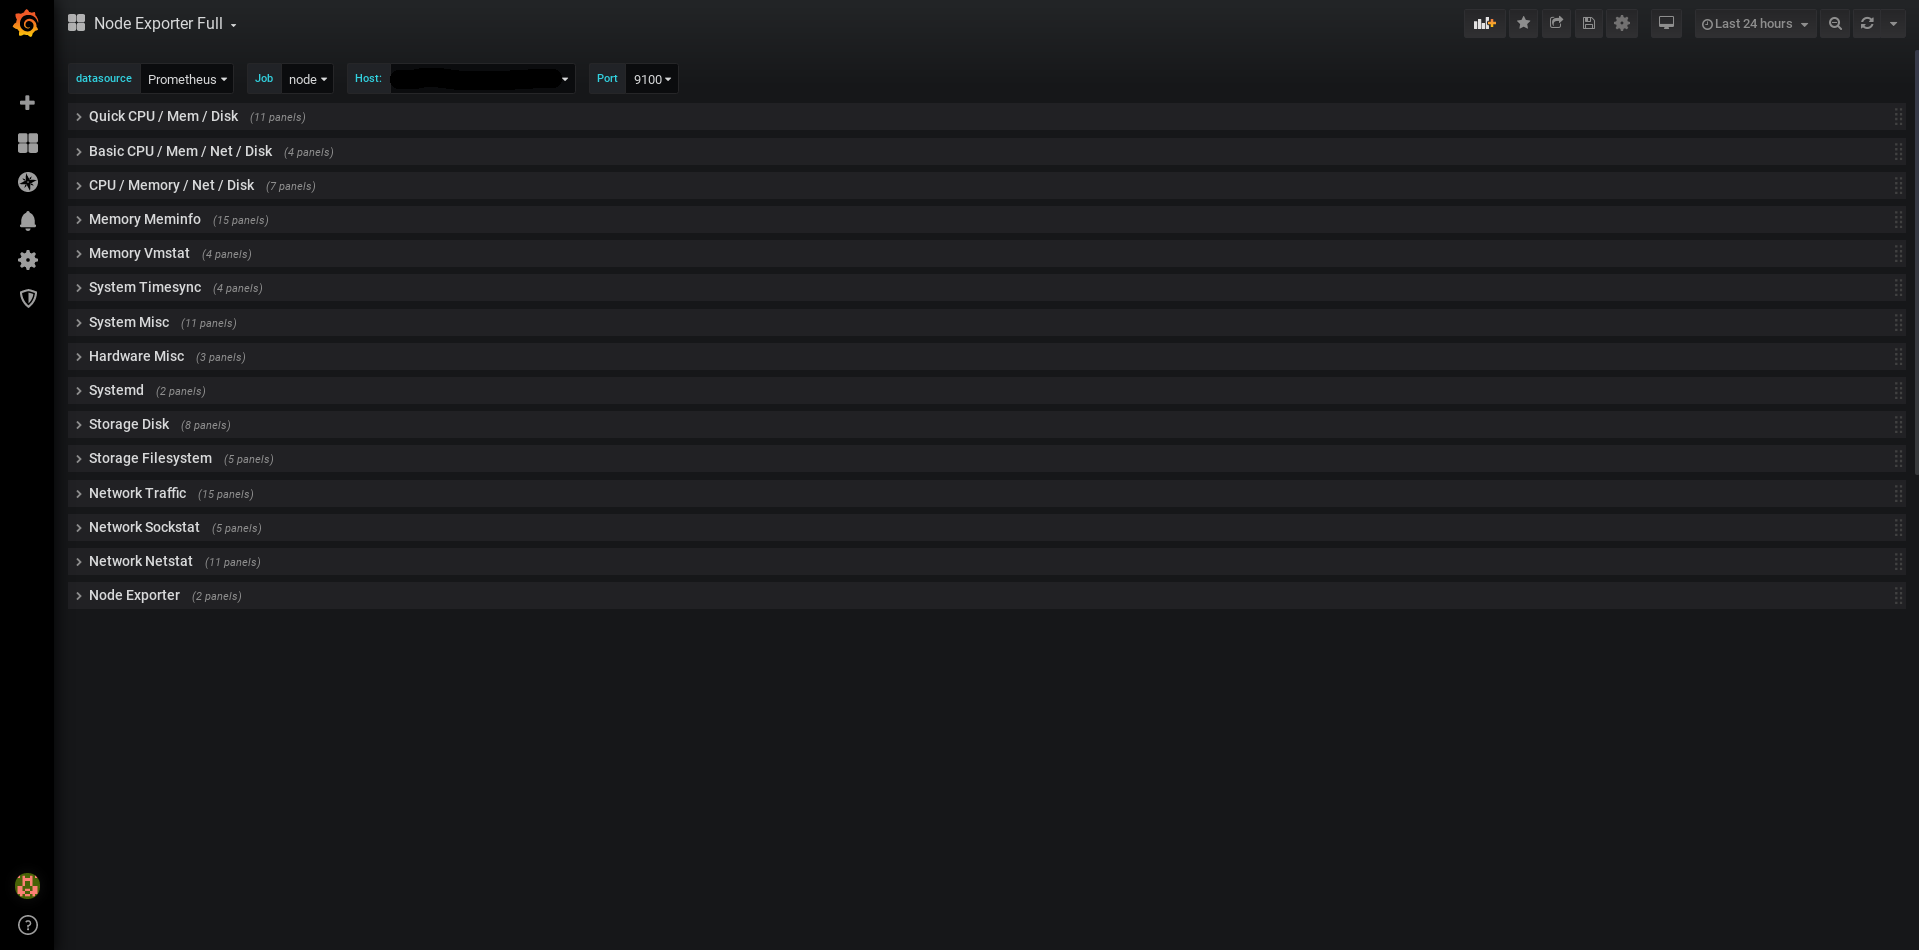
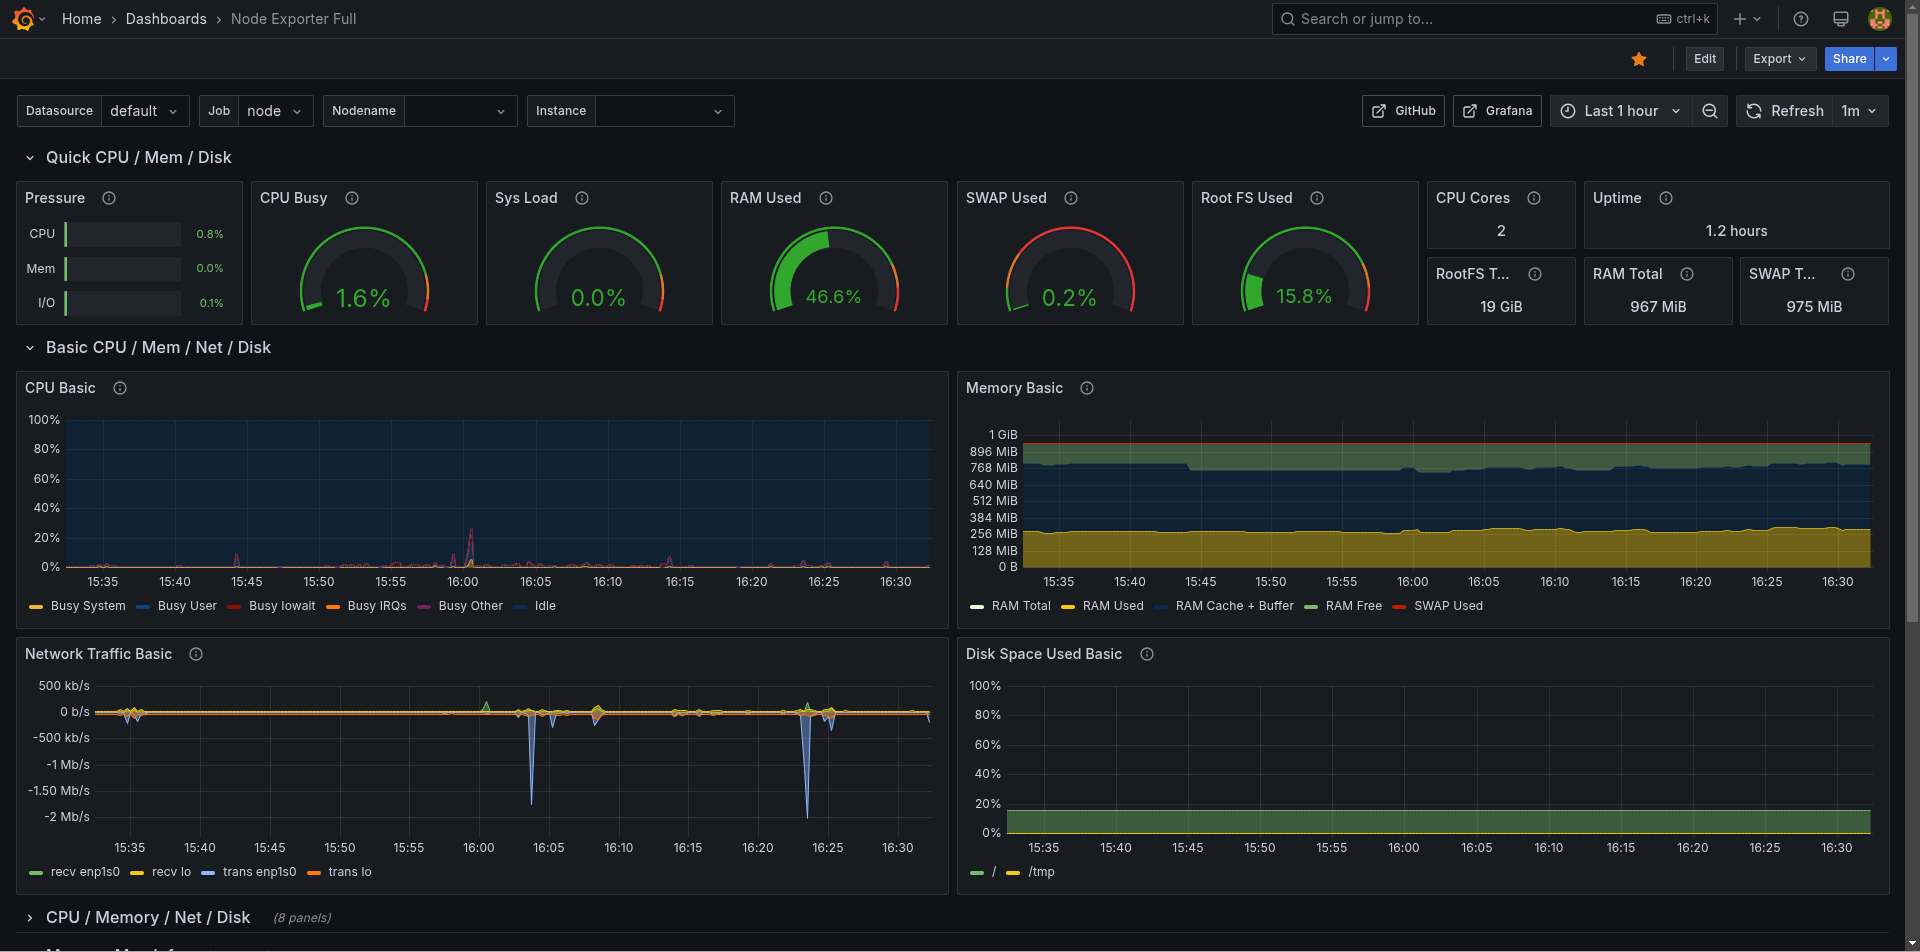
Nearly all default values exported by Prometheus node exporter graphed.
Only requires the default job_name: node, add as many targets as you need in '/etc/prometheus/prometheus.yml'.
  - job_name: node
    static_configs:
      - targets: ['localhost:9100']
Recommended for prometheus-node-exporter the arguments '--collector.systemd --collector.processes' because the graph uses some of their metrics.
Since revision 16, for prometheus-node-exporter v0.18 or newer. Since revision 12, for prometheus-node-exporter v0.16 or newer.
Available on github: https://github.com/rfmoz/grafana-dashboards.git
Data source config
Collector type:
Collector plugins:
Collector config:
Revisions
Upload an updated version of an exported dashboard.json file from Grafana
| Revision | Description | Created | |
|---|---|---|---|
| Download |
Linux Server
Monitor Linux with Grafana. Easily monitor your Linux deployment with Grafana Cloud's out-of-the-box monitoring solution.
Learn more