
Rabbit Monitor
Simple server monitor written in Rust
RabbitMonitor2
Rabbit Monitor is a simple program written in Rust that collects computer stats every 3 seconds (By default) and create /metrics API endpoint for other programs like Prometheus, Grafana... to collect data and display it.
API Endpoints:
Available options:
  -a, --address <ADDRESS>        Bind the server to specific address [default: 0.0.0.0]
  -p, --port <PORT>              Bind the server to specific port [default: 8088]
  -c, --cache <CACHE>            Cache time in seconds [default: 3]
  -t, --token <TOKEN>            Bearer token for authentication (optional)
      --interfaces <INTERFACES>  Comma-separated list of network interfaces to monitor (e.g., "eth0,wlan0")
      --all-metrics              Enable all detailed metrics
      --cpu-details              Enable detailed CPU metrics
      --memory-details           Enable detailed memory metrics
      --swap-details             Enable detailed swap metrics
      --storage-details          Enable detailed storage metrics
      --network-details          Enable detailed network metrics
  -h, --help                     Print help
  -V, --version                  Print version
Installation
# Download the binary
wget https://github.com/Rabbit-Company/RabbitMonitor2/releases/latest/download/rabbitmonitor-$(uname -m)-gnu
# Set file permissions
sudo chmod 777 rabbitmonitor-$(uname -m)-gnu
# Place the binary to `/usr/local/bin`
sudo mv rabbitmonitor-$(uname -m)-gnu /usr/local/bin/rabbitmonitor
# Start the monitor
rabbitmonitor
Daemonizing (using systemd)
Running Rabbit Monitor in the background is a simple task, just make sure that it runs without errors before doing this. Place the contents below in a file called rabbitmonitor.service in the /etc/systemd/system/ directory.
[Unit]
Description=Rabbit Monitor
After=network.target
[Service]
Type=simple
User=root
ExecStart=rabbitmonitor –interfaces eth0 –all-metrics
TimeoutStartSec=0
TimeoutStopSec=2
RemainAfterExit=yes
[Install]
WantedBy=multi-user.target
Then, run the commands below to reload systemd and start Rabbit Monitor.
systemctl enable --now rabbitmonitor
Upgrade
# Stop service
systemctl stop rabbitmonitor
Download Rabbit Monitor
wget https://github.com/Rabbit-Company/RabbitMonitor2/releases/latest/download/rabbitmonitor-$(uname -m)-gnu
sudo chmod 777 rabbitmonitor-$(uname -m)-gnu
sudo mv rabbitmonitor-$(uname -m)-gnu /usr/local/bin/rabbitmonitor
Start service
systemctl start rabbitmonitor
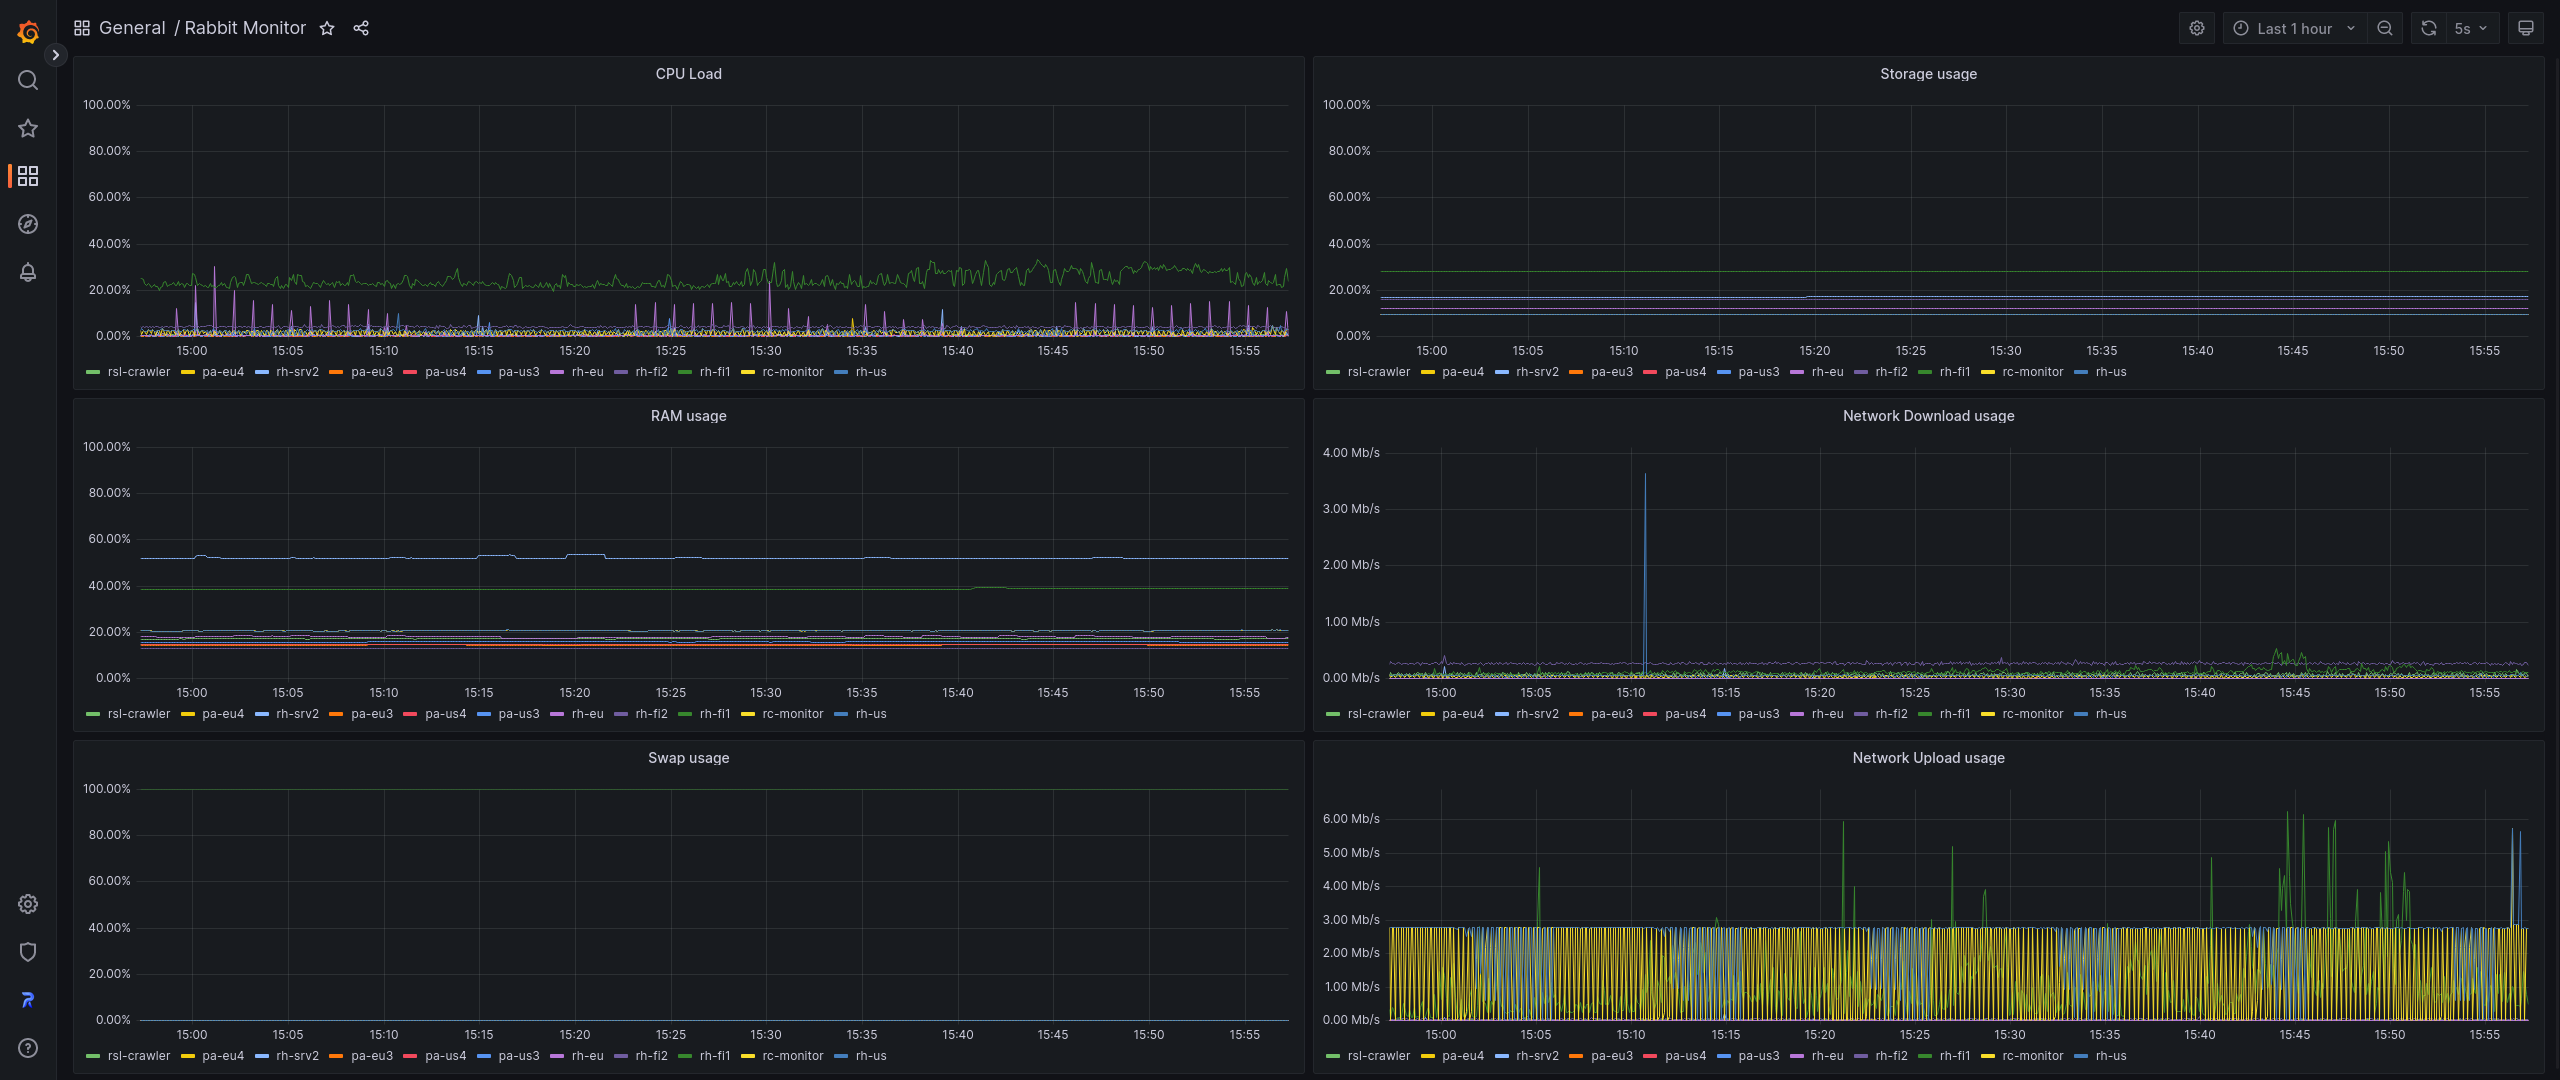
Grafana Dashboard
Rabbit Monitor has a pre-made Grafana dashboard that looks like this:

It can be installed from official Grafana website: https://grafana.com/grafana/dashboards/18562
Data source config
Collector config:
Upload an updated version of an exported dashboard.json file from Grafana
| Revision | Description | Created | |
|---|---|---|---|
| Download |