Windows Metrics
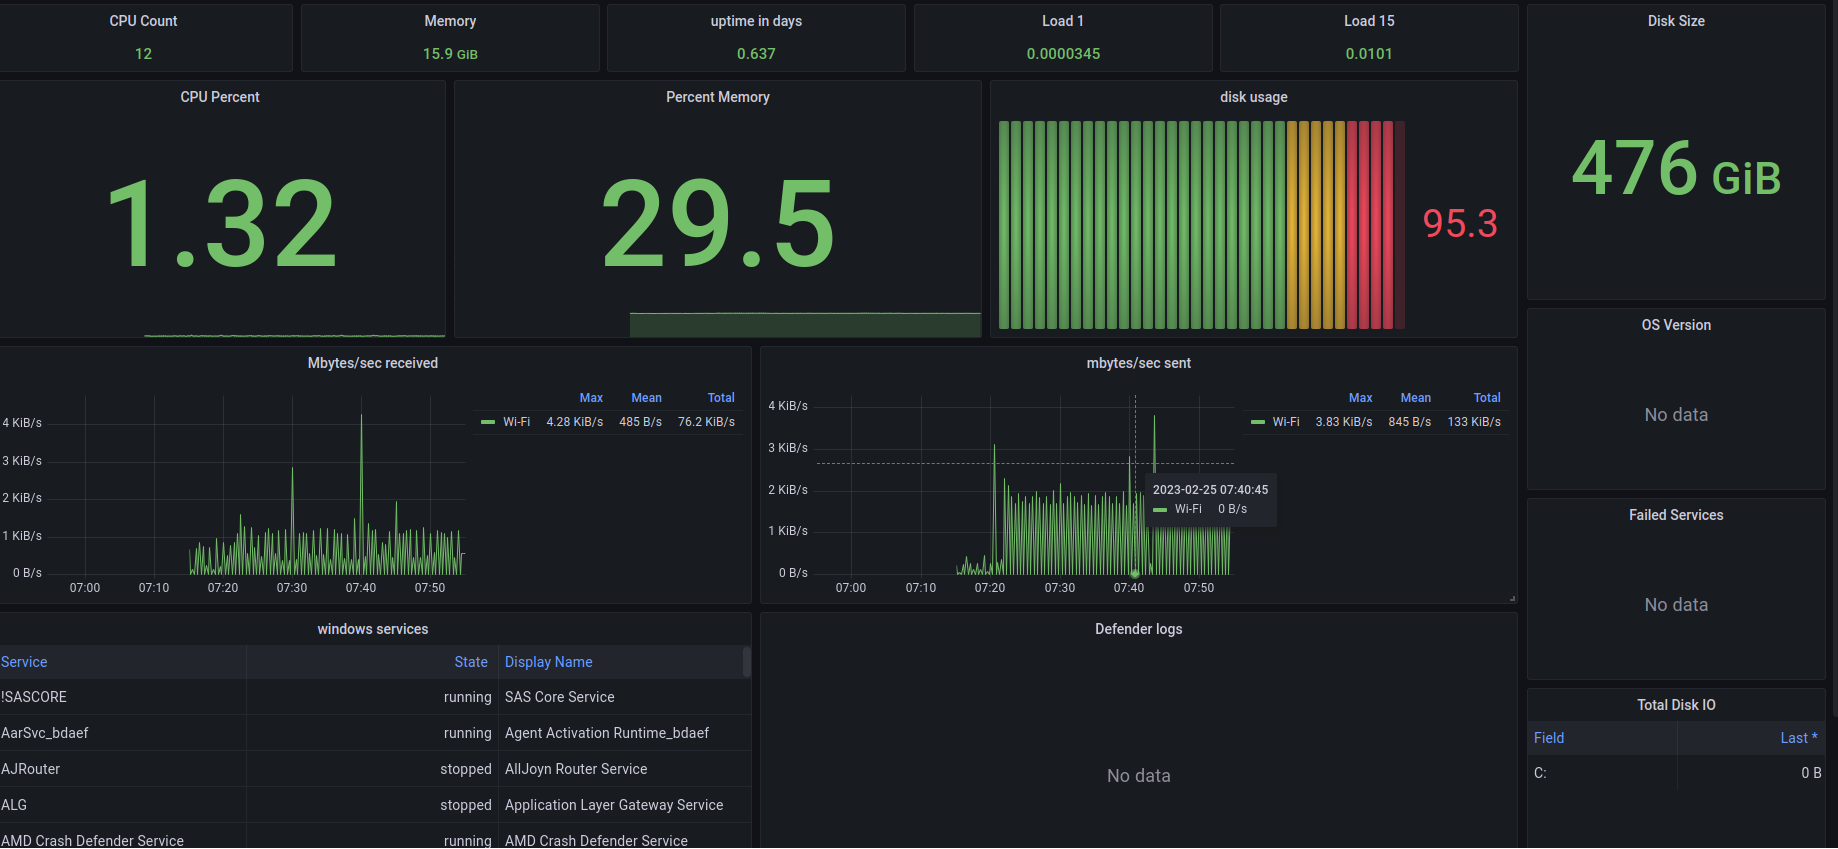
Uses Telegraf, Victoriametrics, and Loki to display metrics and logs from a windows systems used by shift-mon
this Dashboard Shows Service status, Resource Usage, and Defend stats from windows. If you need help installing an observability stack or telegraf please reference our gitlab repo
Data source config
Collector config:
Upload an updated version of an exported dashboard.json file from Grafana
| Revision | Description | Created | |
|---|---|---|---|
| Download |
Windows
Easily monitor your deployment of the Windows operating system with Grafana Cloud's out-of-the-box monitoring solution.
Learn more
