Blocky-Postgres
Grafana dashboard for Blocky with PostgreSQL query logging
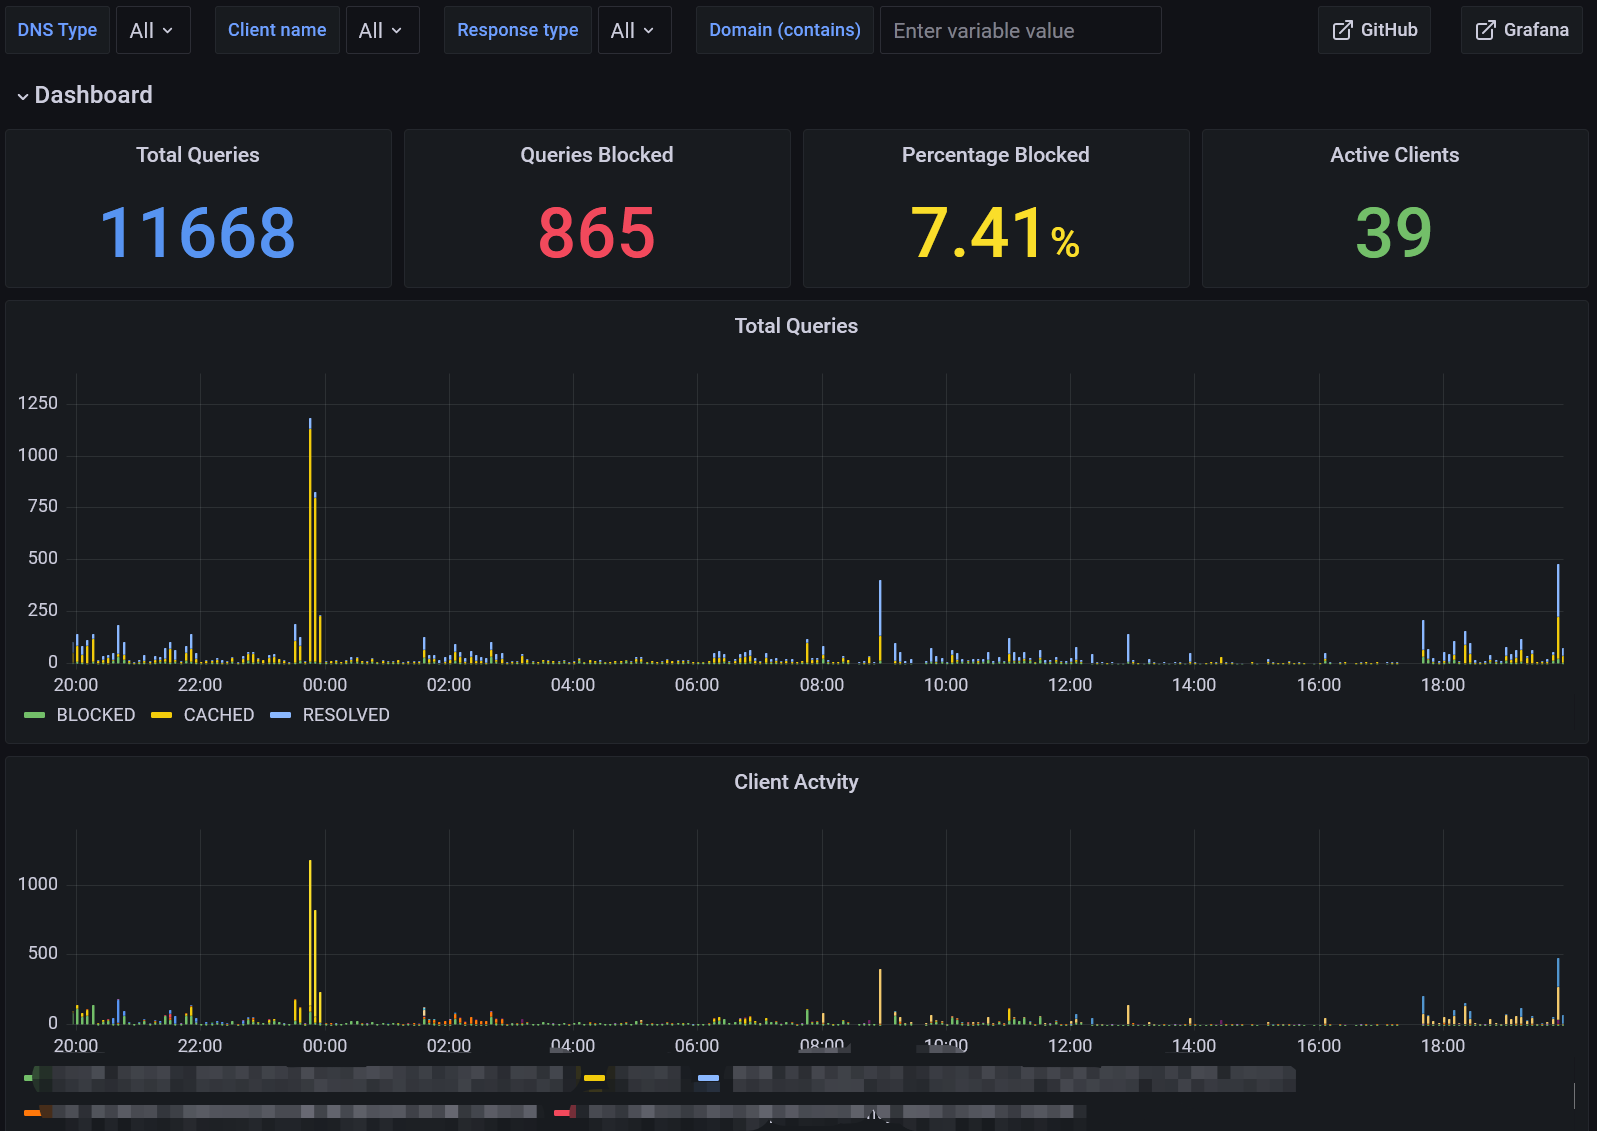
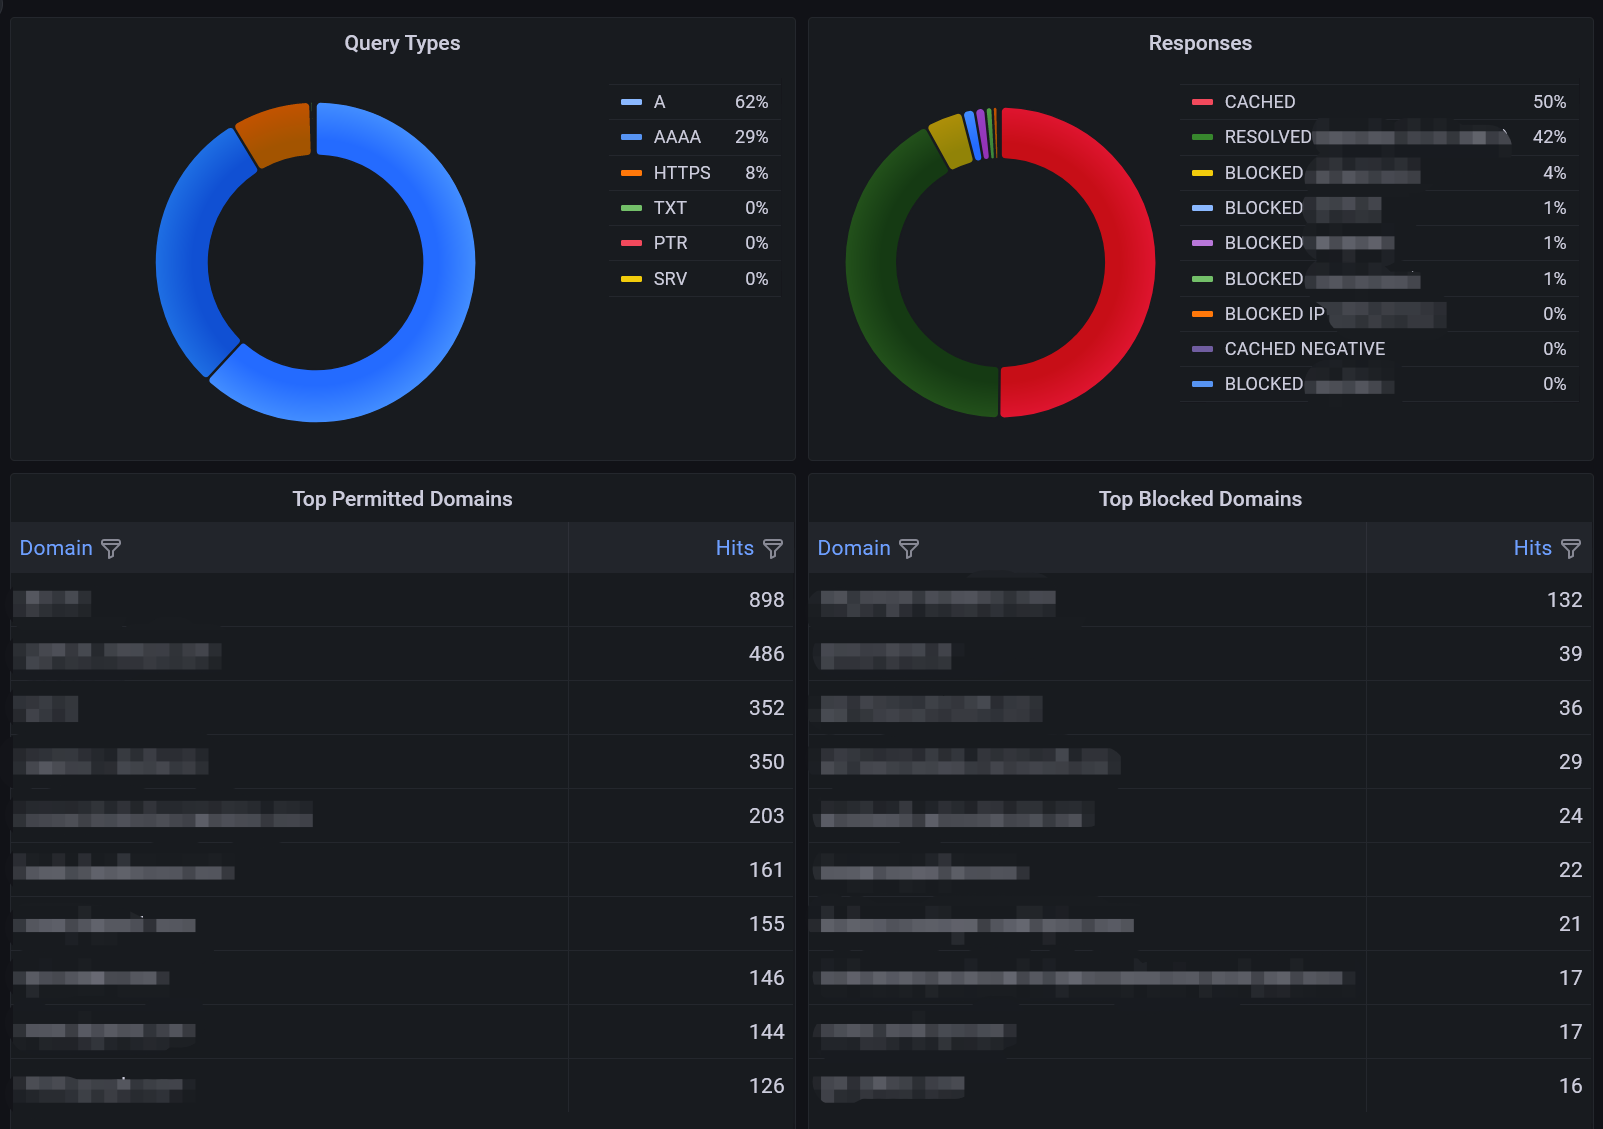
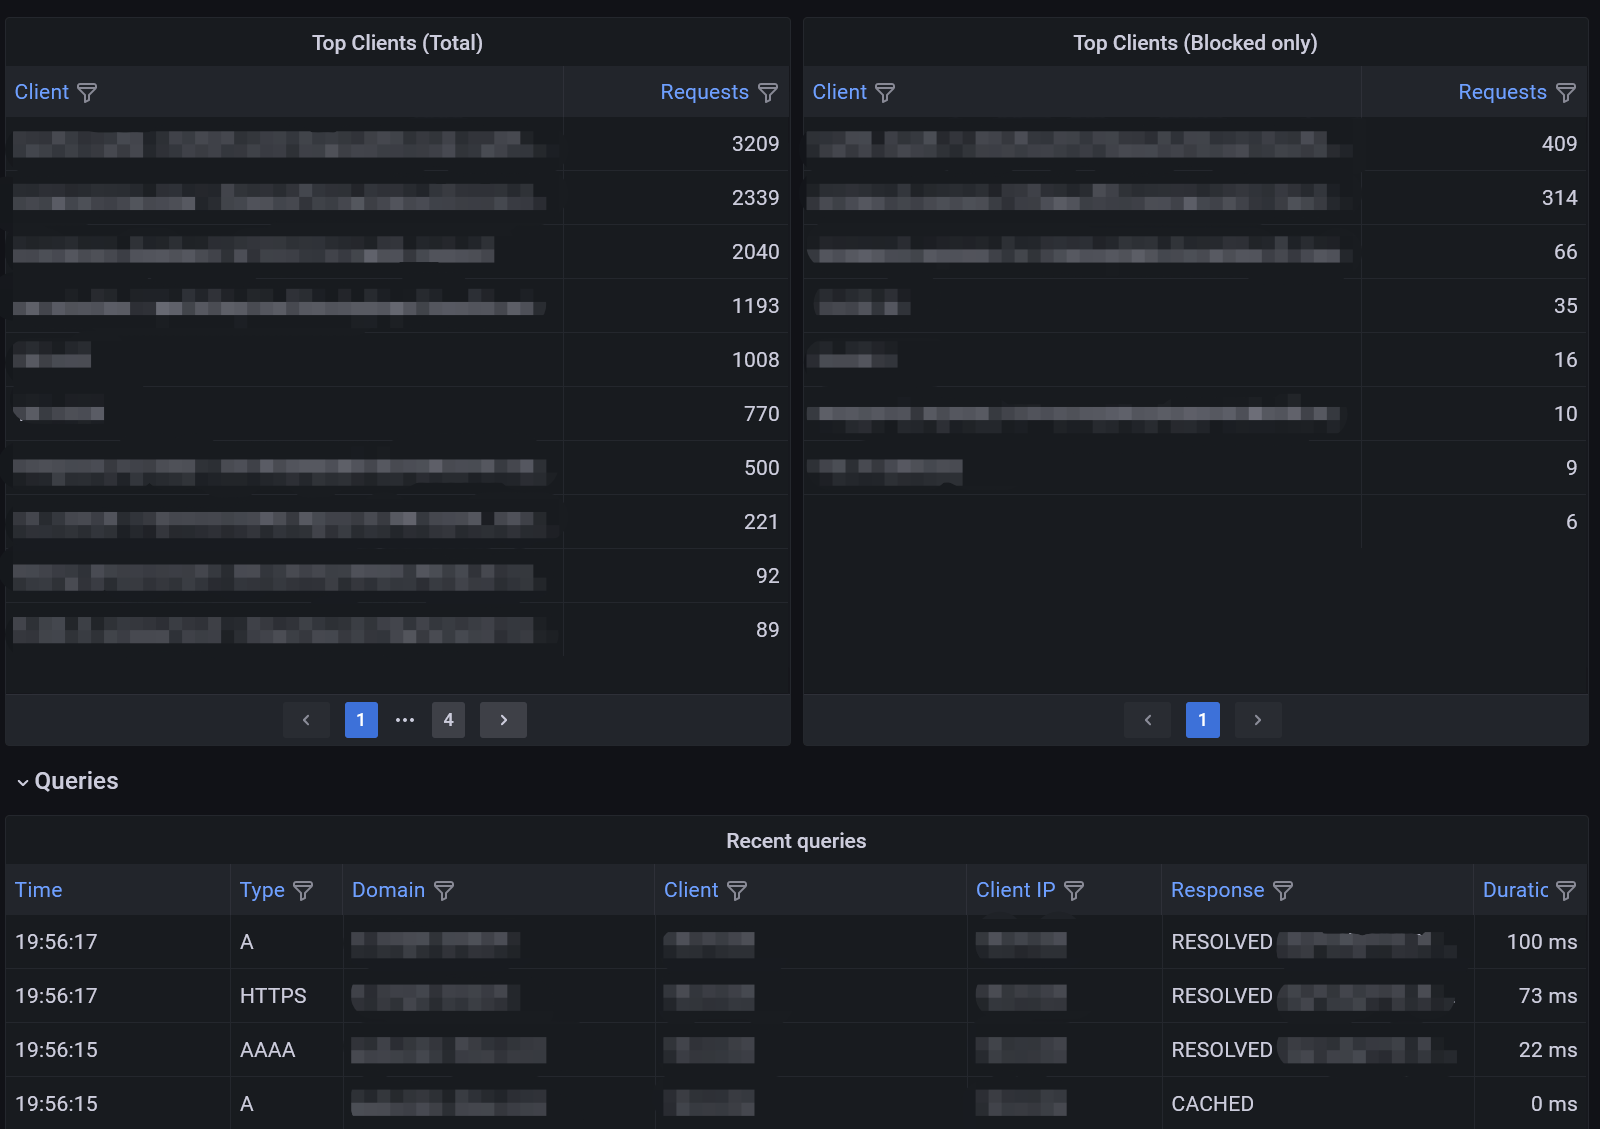
This is a Grafana dashboard for Blocky with PostgreSQL query logging. It displays top clients, top domains, recent queries and more.
To use this dashboard, set Blocky's query log type to PostgreSQL , and setup corresponding PostgreSQL database as data source.
Data source config
Collector config:
Upload an updated version of an exported dashboard.json file from Grafana
| Revision | Description | Created | |
|---|---|---|---|
| Download |
PostgreSQL
Easily monitor your deployment of PostgreSQL, the open source relational database, with Grafana Cloud's out-of-the-box monitoring solution.
Learn more


