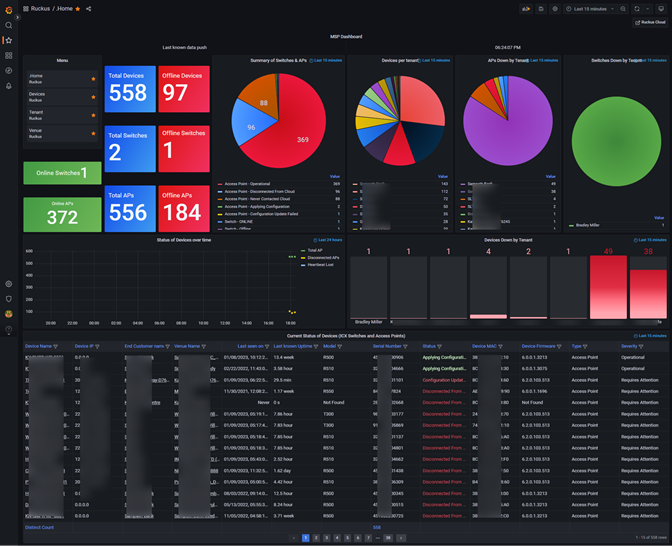
RUCKUS MSP Cloud Dashboard - Home
This Dashboard queries all APs from all the End Customers (tenants) of RUCKUS MSP Cloud and show a single windows to monitor
Dashboard gets data from influxdb measurements created by a python project hosted at GitHub link given below. Python script parses API data from RUCKUS MSP Cloud and stores them in influxDB.
GitHub https://github.com/indhradhanush OR https://github.com/commscope-ruckus/RUCKUS-Cloud-MSP-Grafana
https://www.commscope.com/ruckuscloud https://ruckus.cloud/ https://docs.commscope.com
Data source config
Collector config:
Upload an updated version of an exported dashboard.json file from Grafana
| Revision | Description | Created | |
|---|---|---|---|
| Download |
Home Assistant
Easily monitor Home Assistant, an open source software platform designed for home automation, with Grafana Cloud's out-of-the-box monitoring solution.
Learn more
