
Speedtest Tracker v2 - InfluxDBv2
A dashboard to display data exported by Speedtest Tracker
Speedtest-Tracker-v2-InfluxDBv2
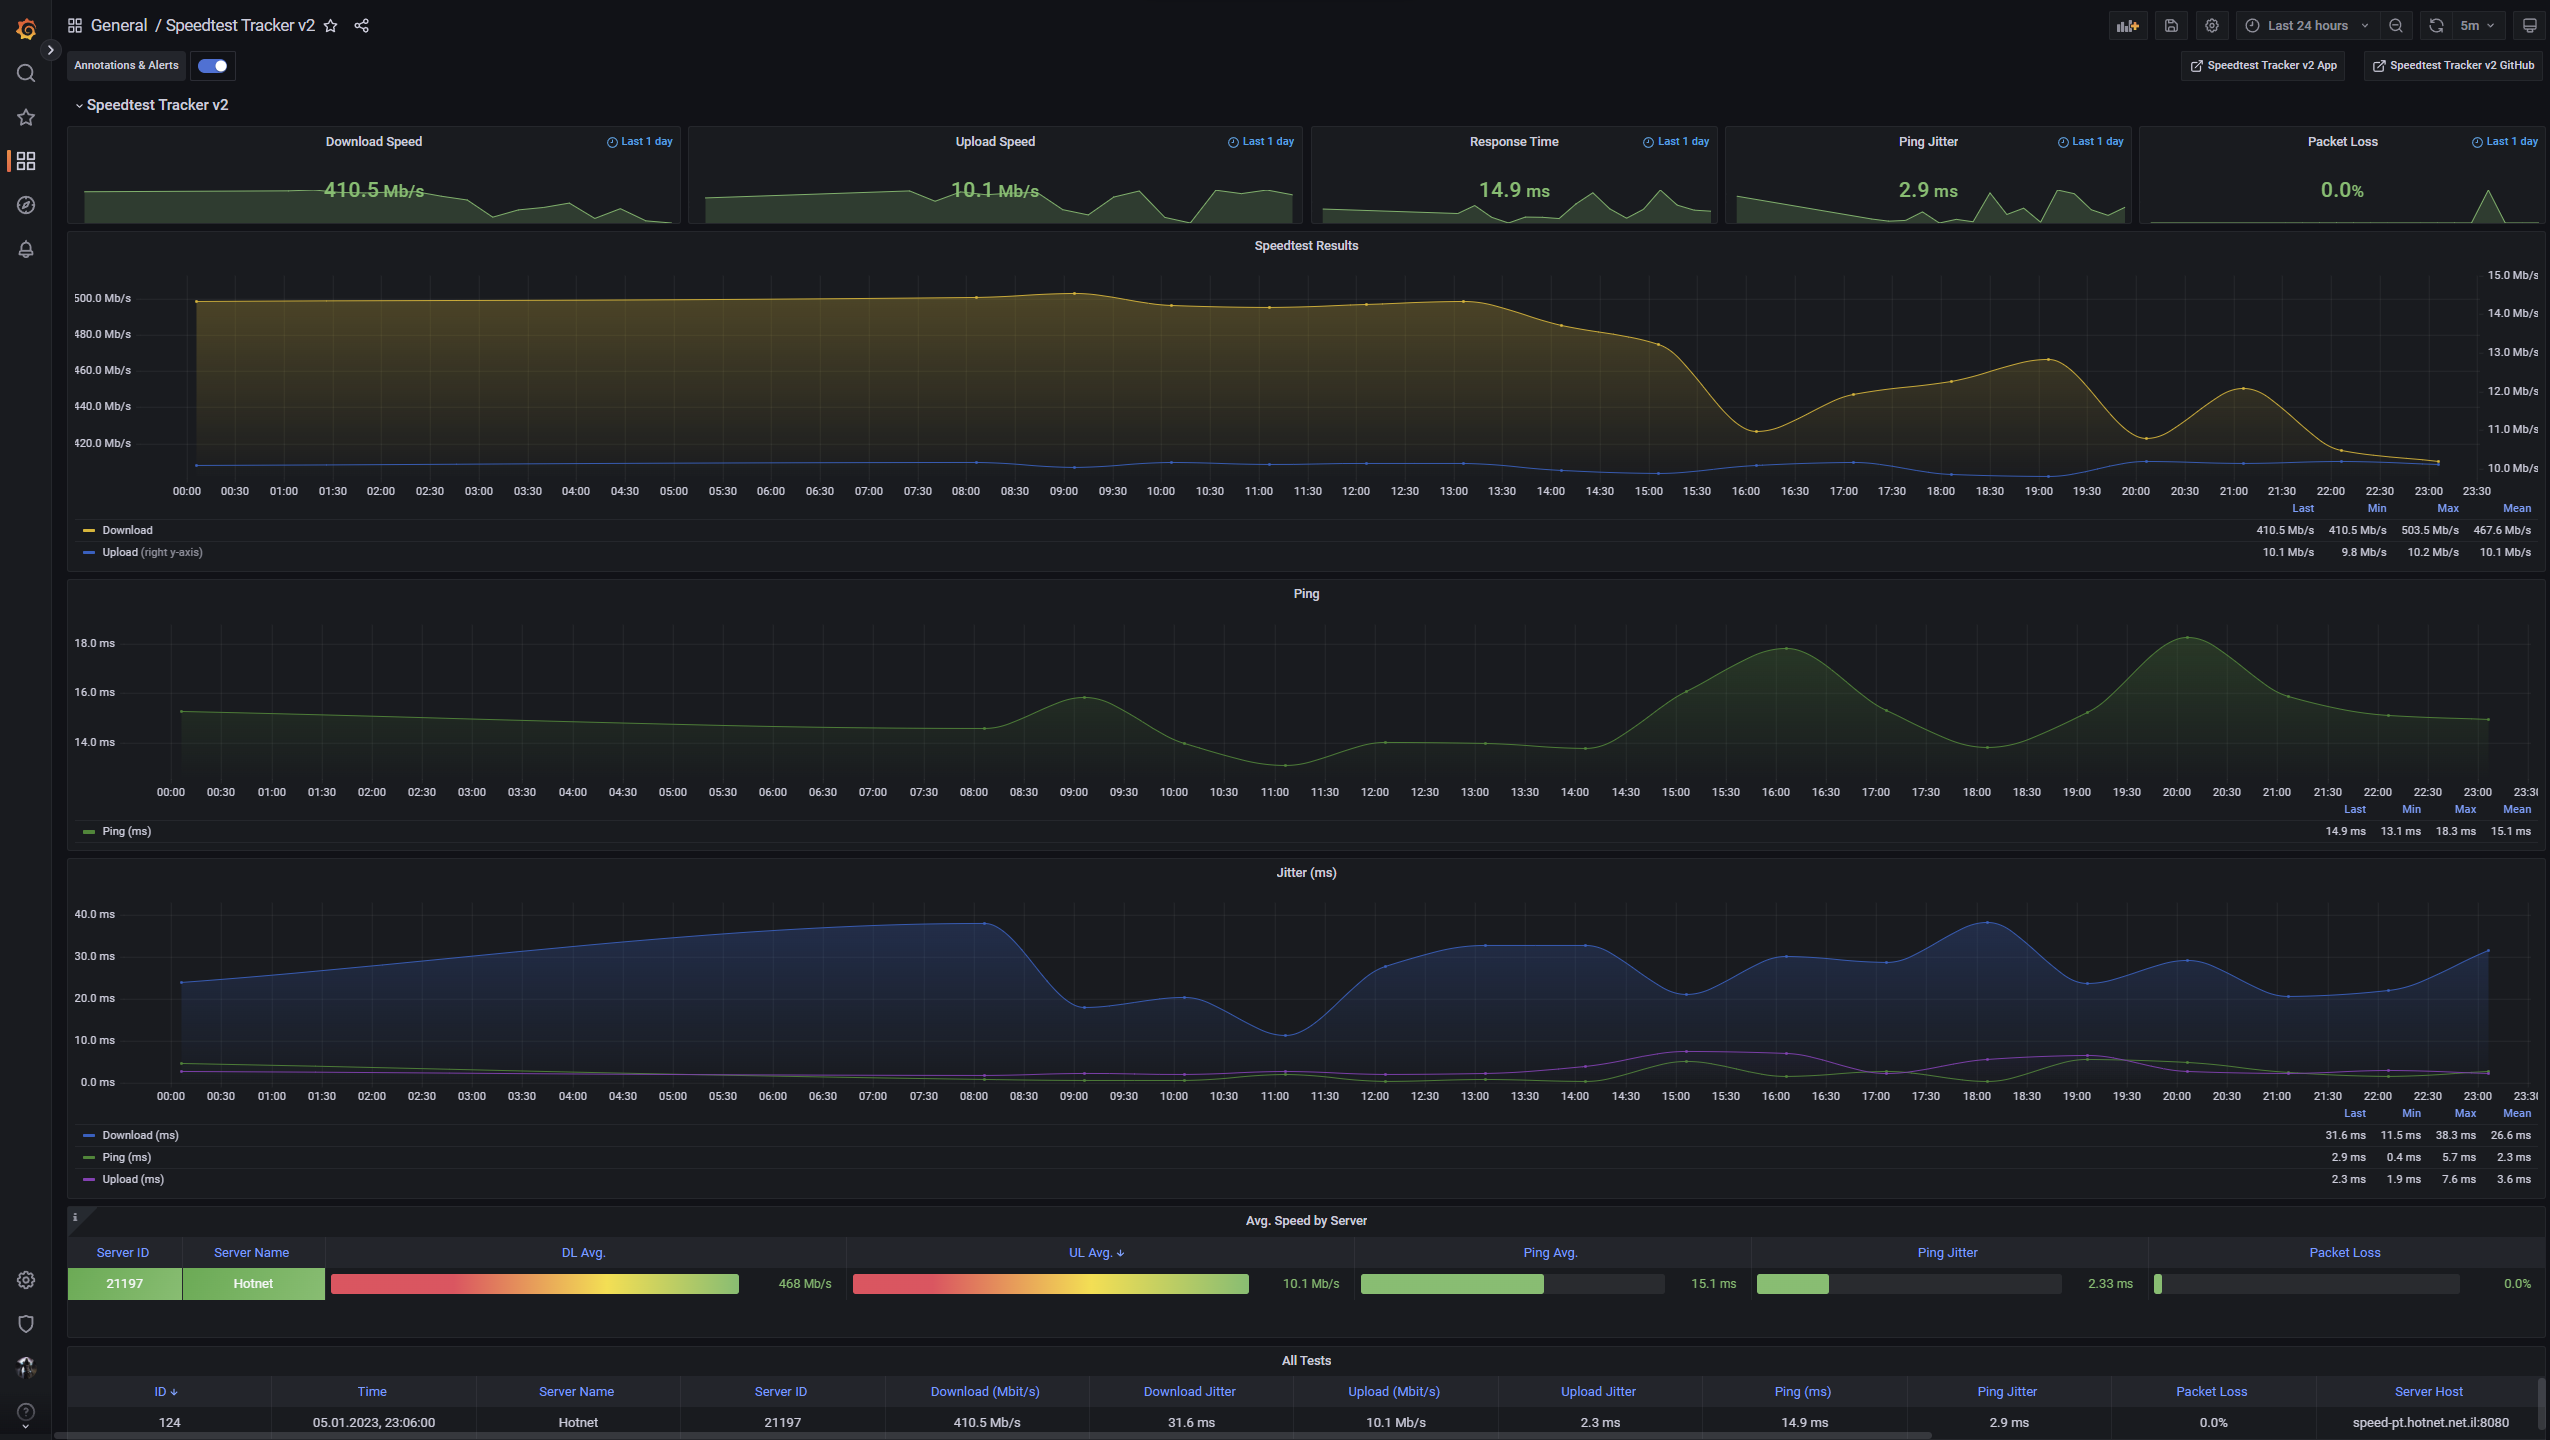
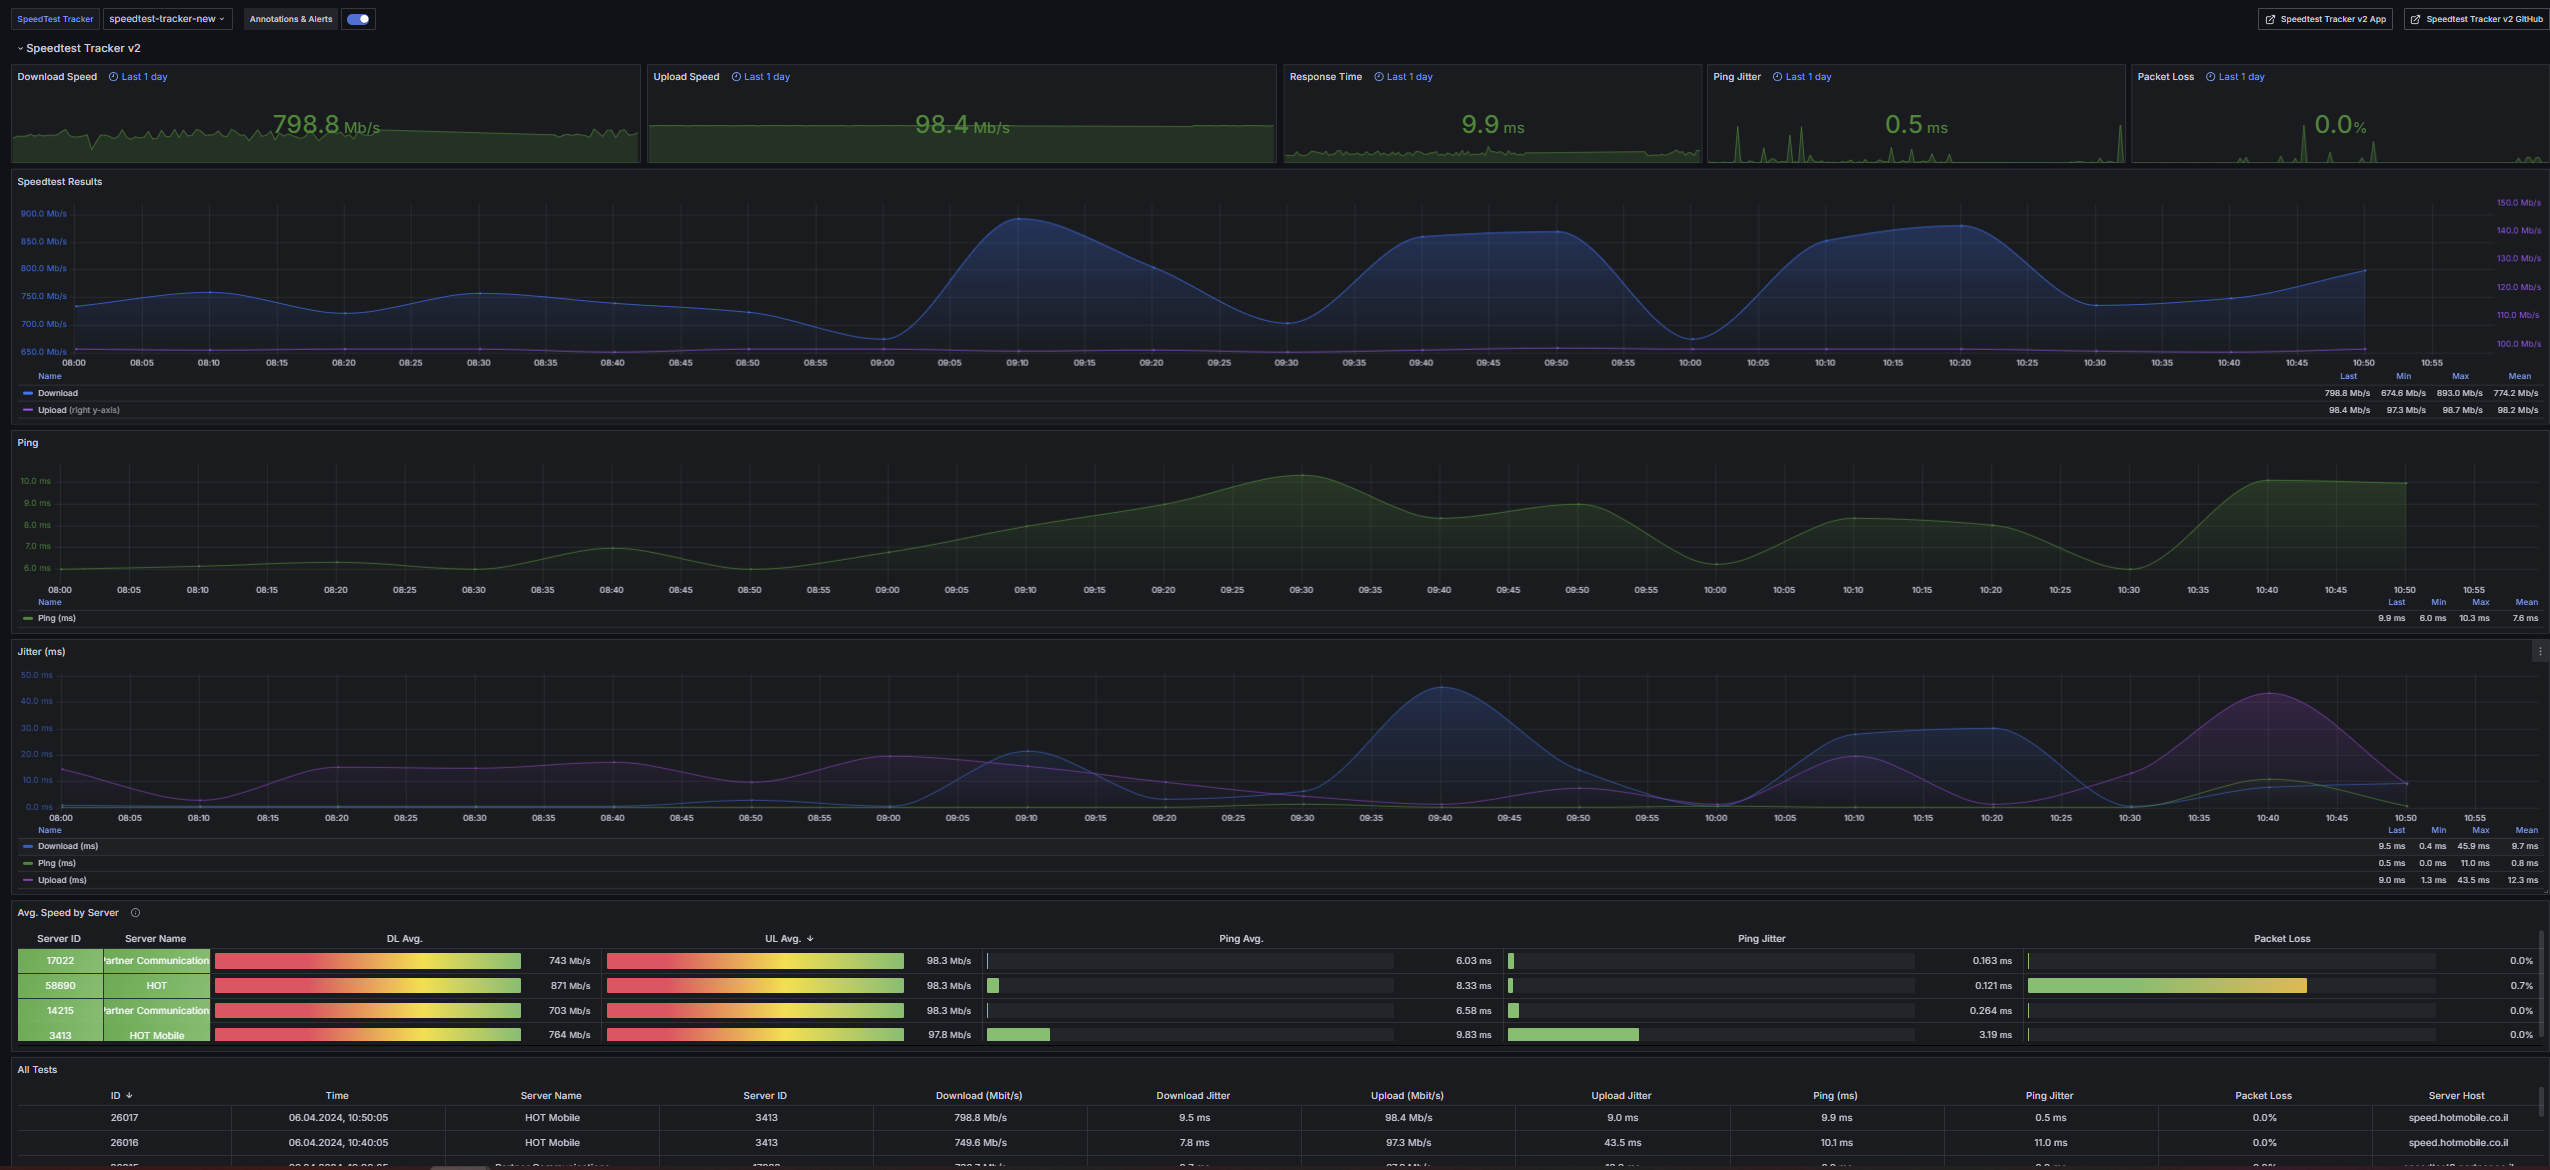
A dashboard to display data exported by Speedtest Tracker v2 . Avalible Now at Grafana Dashboard 17808 (https://grafana.com/grafana/dashboards/17808-speedtest-tracker-v2-influxdbv2/)
This dashboard shows data collected by Speedtest Tracker v2 https://github.com/alexjustesen/speedtest-tracker and exported in an InfluxDBv2 database in the bucket.
Dashboard based on my previous dashboard Speedtest Tracker - InfluxDBv2 with guide for OLD Speedtest Tracker app. https://grafana.com/grafana/dashboards/16428-speedtest-tracker/
Same steps here as before for exporting data but without needs for influxDBv1. Check Here
Info
Updates
8.12.24
- Fixed time in Latest result panel.
7.12.24
- Compatibility Update for Speedtest Tracker v0.25: some fields have been moved to tags + some fixes.
14.8.24
- More Panels added + some fixes.
20.4.24
- Panels fixed + Avg Speed fixed.
6.4.24
- Added Multi bucket support.
Multi buckets
You can change bucket name and add multiple buckets by:
- Go to Dashboard Setting - Variables - Click on bucket - Custom options - Add new buckets
Steps
1. Create bucket in InfluxDBv2: speedtest-tracker
2.1 Create or use existing API token (ALL ACCESS) for Grafana and auth.
2.2 Create API token (read/write) for this bucket to use with speedtest-tracker or use existing.
-
Configure Speedtest Tracker application with relevant InfluxDBv2 configuration: URL, org, bucket, token, etc…, and 'Test connection'
-
Check in InfluxDBv2 in Data Explorer that test data exists in bucket
-
Configure Grafana to use with data from InfluxDBv2 ( Select Datasource = InfluxDB , Query Language = Flux , Organization = yourorg , Bucket = speedtest-tracker , Token = yourtoken for bucket )
-
Import this dashboard to Grafana (Dashboard > New > Import) using link in README.md
-
Return to Speedtest Tracker application and Export data to InfluxDB (Settings > Data Integration > Export current results)
-
Enjoy

Data source config
Collector config:
Upload an updated version of an exported dashboard.json file from Grafana
| Revision | Description | Created | |
|---|---|---|---|
| Download |