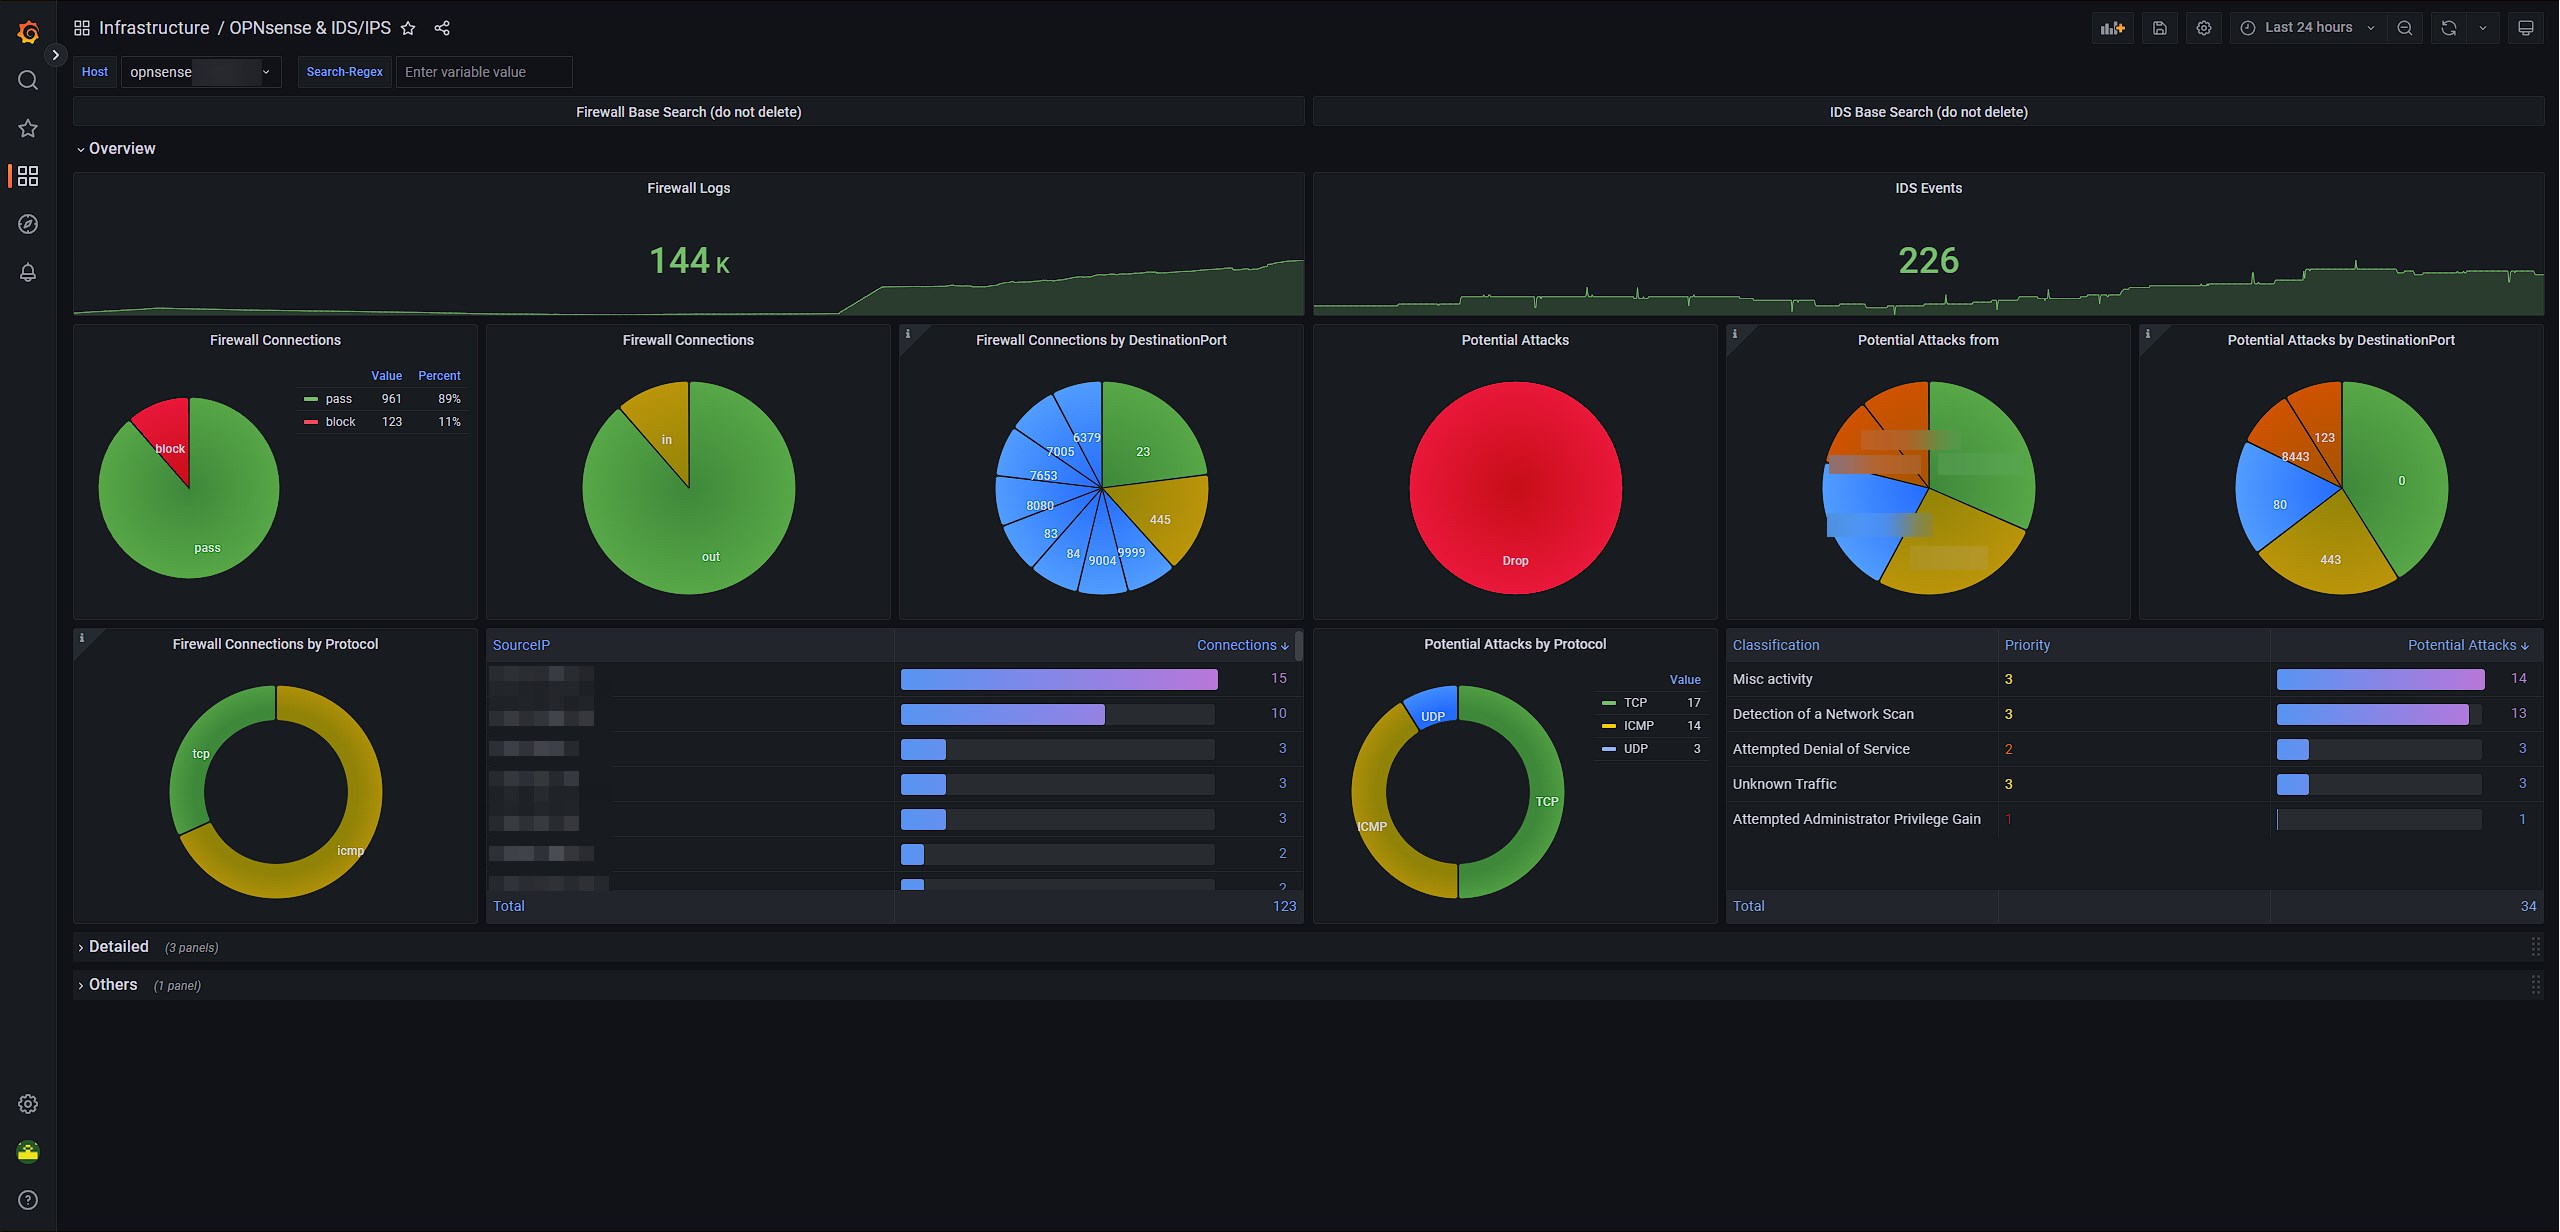
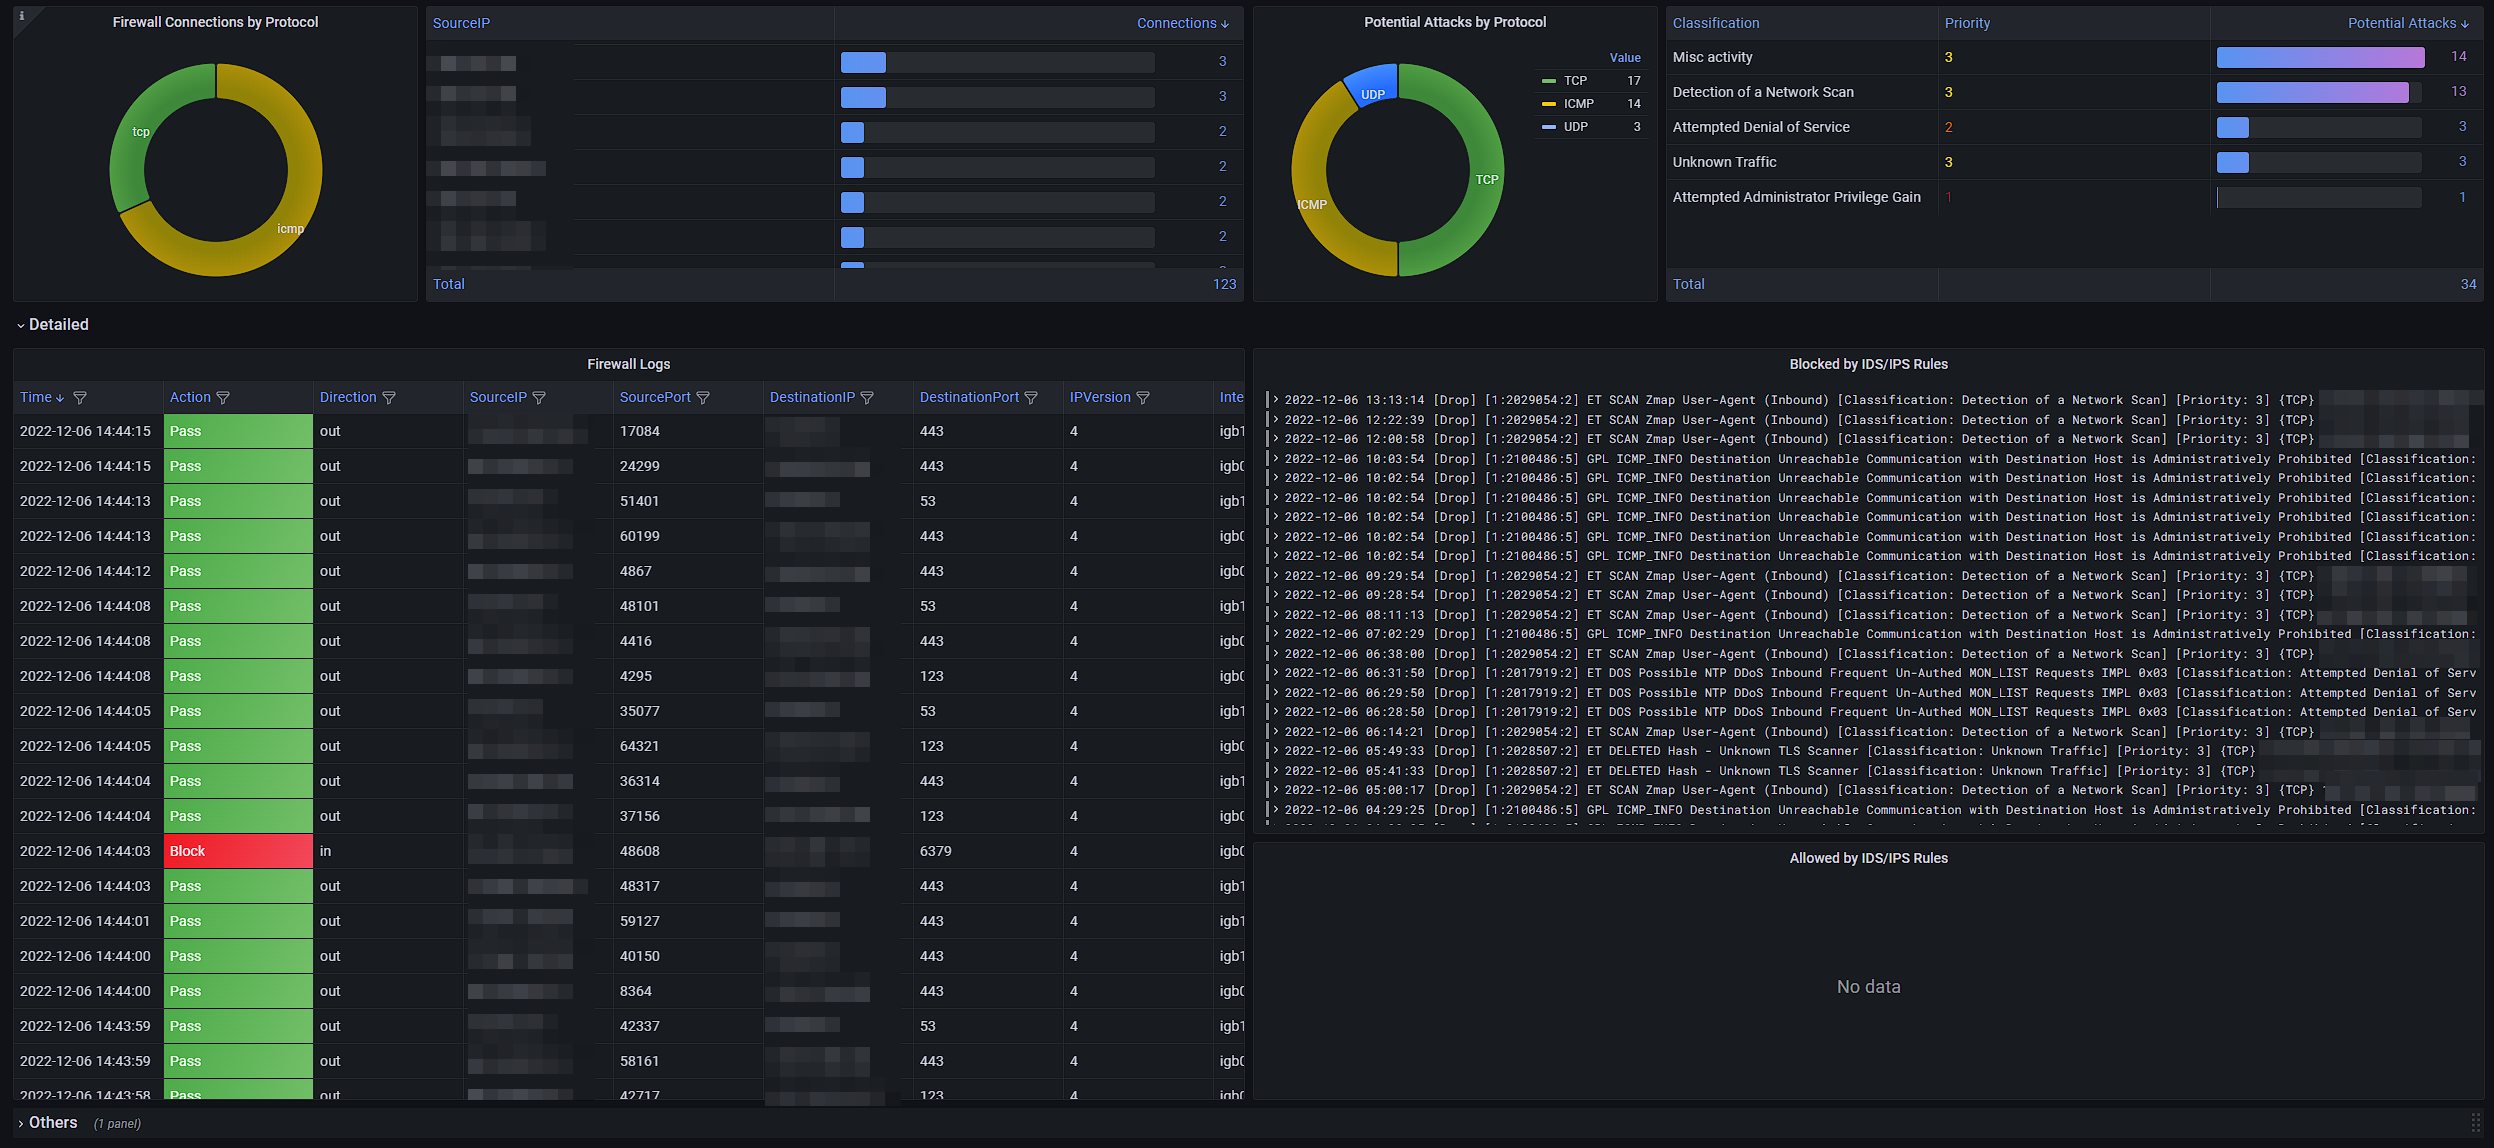
OPNsense & IDS/IPS
Monitoring OPNsense with Loki
Prerequisites to monitor OPNsense Firewall- & IDS/IPS Logs with Loki:
- Loadbalancer to create virtual IP and to publish syslog ports (for example MetalLB)
- Promtail or Grafana Agent to listen on these ports and ship the logs to Loki
- Loki to index the logs
- Grafana to visualize the logs (datasource Loki configured)
- OPNsense syslog target configured
Important!
The Grafana Dashboard only works when your OPNsense IDS/IPS logs has a label job: syslog-ids and all other Firewall logs has a label job: syslog.
Promtail Helm chart example values:
config:
  lokiAddress: "http://loki-gateway/loki/api/v1/push"
  snippets:
    extraScrapeConfigs: |
      # Add an additional scrape config for syslog
      - job_name: syslog
        syslog:
          listen_address: 0.0.0.0:514
          idle_timeout: 60s
          label_structured_data: yes
          labels:
            job: "syslog"
        relabel_configs:
          - source_labels: ['__syslog_message_hostname']
            target_label: 'host'
      # Add an additional scrape config for OPNsense IDS alerts shipped over syslog
      - job_name: syslog-ids
        syslog:
          listen_address: 0.0.0.0:1514
          idle_timeout: 60s
          label_structured_data: yes
          labels:
            job: "syslog-ids"
        relabel_configs:
          - source_labels: ['__syslog_message_hostname']
            target_label: 'host'
extraPorts:
Add an additional port for syslog
serviceType "LoadBalancer" only works if you have deployed an Loadbalancer for example MetalLB
syslog:
name: tcp-syslog
containerPort: 514
protocol: TCP
service:
type: LoadBalancer
#clusterIP: null
port: 514
#externalIPs: []
#nodePort: 32682
#annotations: {}
#labels: {}
#loadBalancerIP: null
#loadBalancerSourceRanges: []
#externalTrafficPolicy: null
Add an additional port for OPNsense IDS alerts shipped over syslog
serviceType "LoadBalancer" only works if you have deployed an Loadbalancer for example MetalLB
syslog-ids:
name: tcp-syslog-ids
containerPort: 1514
protocol: TCP
service:
type: LoadBalancer
#clusterIP: null
port: 1514
#externalIPs: []
#nodePort: 32682
#annotations: {}
#labels: {}
#loadBalancerIP: null
#loadBalancerSourceRanges: []
#externalTrafficPolicy: null
You can also find our Dashboards on GitHub.
Data source config
Collector config:
Upload an updated version of an exported dashboard.json file from Grafana
| Revision | Description | Created | |
|---|---|---|---|
| Download |


