
Apache Camel - Context view
Apache Camel 3 & 4 - Statistics on Camel Context level
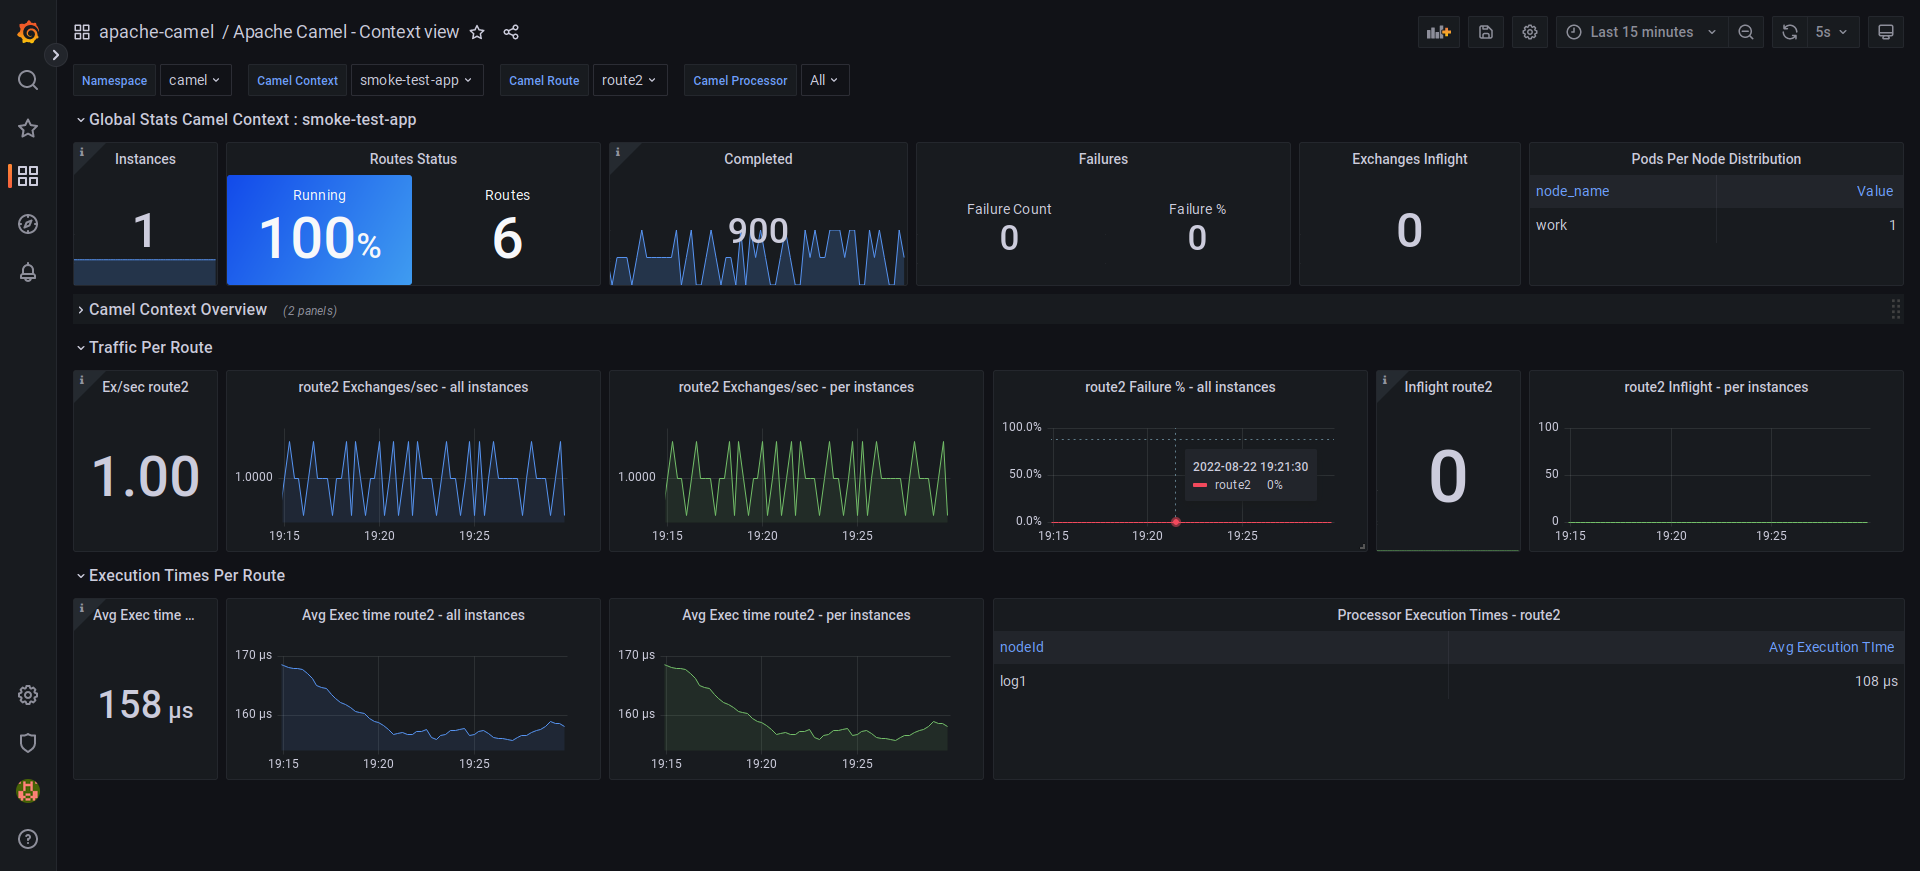
Performance oriented monitoring on Apache Camel 3 & 4 deployments. Works ideally on Kubernetes deployments. Based on Prometheus datasource scraping metrics coming from the micrometer framework. Focuses on analyzing Camel Context, Route & Processor execution times and throughput.
Min required versions :
- Apache Camel 3.21+
- Apache Camel 4.0.0-M3+
Mixin install commands
jb init
jb install https://github.com/alainpham/app-archetypes/camel-monitoring/camel-dashboards/
Application instrumentation
Micrometer is supported on Spring Boot, Quarkus and Camel K flavors. See the project archetypes quarkus-camel and spring-boot-camel here to have ready to use instrumented Apache Camel projects.
https://github.com/alainpham/app-archetypes
If you don't want to use the archetype, the instrumentation of the application is as simple very simple like described in the following paragraphs.
For Quarkus
pom.xml
<dependency>
    <groupId>io.micrometer</groupId>
    <artifactId>micrometer-registry-prometheus</artifactId>
</dependency>
<dependency>
    <groupId>org.apache.camel.quarkus</groupId>
    <artifactId>camel-quarkus-micrometer</artifactId>
</dependency>
application.properties
quarkus.camel.metrics.enable-message-history=true
For Spring Boot
pom.xml
<dependency>
    <groupId>io.micrometer</groupId>
    <artifactId>micrometer-registry-prometheus</artifactId>
    </dependency>
<dependency>
    <groupId>org.apache.camel.springboot</groupId>
    <artifactId>camel-micrometer-starter</artifactId>
</dependency>
Configuration class
Create a configuration class in your spring boot project.
import org.apache.camel.builder.RouteBuilder;
import org.apache.camel.component.micrometer.eventnotifier.MicrometerExchangeEventNotifier;
import org.apache.camel.component.micrometer.eventnotifier.MicrometerRouteEventNotifier;
import org.apache.camel.component.micrometer.messagehistory.MicrometerMessageHistoryFactory;
import org.apache.camel.component.micrometer.routepolicy.MicrometerRoutePolicyFactory;
import org.springframework.stereotype.Component;
@Component
public class Configurator extends RouteBuilder {
@Override
public void configure() throws Exception {
getContext().addRoutePolicyFactory(new MicrometerRoutePolicyFactory());
getContext().setMessageHistoryFactory(new MicrometerMessageHistoryFactory());
getCamelContext().getManagementStrategy().addEventNotifier(new MicrometerExchangeEventNotifier());
getCamelContext().getManagementStrategy().addEventNotifier(new MicrometerRouteEventNotifier());
}
}
Prometheus scraping
Dashboard is designed for metrics scraped from kubernetes deployment
This is the scrape config to be used as an example
# inspired by the prometheus kubernetes helm chart
global:
  scrape_interval: 15s
  external_labels:
    cluster: cloud
scrape_configs:
  - job_name: integrations/kubernetes/applications
    bearer_token_file: /var/run/secrets/kubernetes.io/serviceaccount/token
    honor_labels: true
    kubernetes_sd_configs:
      - role: pod
        namespaces:
          own_namespace: true
    relabel_configs:
      - source_labels: [__meta_kubernetes_pod_annotation_prometheus_io_scrape]
        action: keep
        regex: true
      - source_labels: [__meta_kubernetes_pod_annotation_prometheus_io_scrape_slow]
        action: drop
        regex: true
      - source_labels: [__meta_kubernetes_pod_annotation_prometheus_io_scheme]
        action: replace
        regex: (https?)
        target_label: __scheme__
      - source_labels: [__meta_kubernetes_pod_annotation_prometheus_io_path]
        action: replace
        target_label: __metrics_path__
        regex: (.+)
      - source_labels: [__meta_kubernetes_pod_annotation_prometheus_io_port, __meta_kubernetes_pod_ip]
        action: replace
        regex: (\d+);(([A-Fa-f0-9]{1,4}::?){1,7}[A-Fa-f0-9]{1,4})
        replacement: '[$2]:$1'
        target_label: __address__
      - source_labels: [__meta_kubernetes_pod_annotation_prometheus_io_port, __meta_kubernetes_pod_ip]
        action: replace
        regex: (\d+);((([0-9]+?)(\.|$)){4})
        replacement: $2:$1
        target_label: __address__
      - action: labelmap
        regex: __meta_kubernetes_pod_annotation_prometheus_io_param_(.+)
        replacement: __param_$1
      - action: labelmap
        regex: __meta_kubernetes_pod_label_(.+)
      - source_labels: [__meta_kubernetes_namespace]
        action: replace
        target_label: namespace
      - source_labels: [__meta_kubernetes_pod_node_name]
        action: replace
        target_label: node
      - source_labels: [__meta_kubernetes_pod_name]
        action: replace
        target_label: pod
      - source_labels: [__meta_kubernetes_pod_phase]
        regex: Pending|Succeeded|Failed|Completed
        action: drop
To scrape instances that are not deployed in kubernetes you can simulate kubernetes labels with the following prometheus configs.
Kubernetes specific labels that need to be simulated are
- app_kubernetes_io_part_of
- app_kubernetes_io_name
- app_kubernetes_io_component
- app_kubernetes_io_instance
- app_kubernetes_io_version
- cluster
- node
- pod
- namespace
global:
  scrape_interval: 15s
  evaluation_interval: 15s
scrape_configs:
  - job_name: "camel-dev"
    metrics_path: /q/metrics
    relabel_configs:
      - target_label: app_kubernetes_io_part_of
        replacement: camel-app
      - target_label: app_kubernetes_io_name
        replacement: camel-app
      - target_label: app_kubernetes_io_component
        replacement: camel-app
      - target_label: app_kubernetes_io_instance
        replacement: camel-app-master
      - target_label: app_kubernetes_io_version
        replacement: "1.0.0"
      - target_label: cluster
        replacement: cloud
      - target_label: node
        replacement: worker-01
      - target_label: pod
        replacement: camel-app-1
      - target_label: namespace
        replacement: camel-ns
    static_configs:
      - targets:
          - "localhost:8090"
Video tutorial material
Watch a demo video here : https://www.youtube.com/watch?v=0LDgv1nIk-Y
or here https://odysee.com/@alainpham:8/apache-camel-monitoring-prometheus-grafana:c
Here is the git repo for setting up the demo : https://github.com/alainpham/app-archetypes
Feel free to asks questions and send me feedback on LinkedIn or Twitter
Data source config
Collector config:
Upload an updated version of an exported dashboard.json file from Grafana
| Revision | Description | Created | |
|---|---|---|---|
| Download |