
Aipix Mediaserver Dashboard
InfluxDB dashboard to collect metrics from Aipix Mediaserver
About
Collector source files can be found on the GitHub Page: https://github.com/Xaipix/mediaserver-collectors
How To Use
- Install and setup Telegraf, InfluxDB, and Grafana to work with eachother.
- Use the provided mediaserver-collector.conf file.
- Clone Git repository with collector:
git clone https://github.com/Xaipix/mediaserver-collectors.git /etc/telegraf/telegraf.d/inputs- Restart Telegraf.
- Import the dashboard json file (or use Grafana Dashboard ID) to add the dashboard and panels to Grafana, selecting your own InfluxDB database after clicking “Import”.
- Enjoy!
Description
Collected metrics:
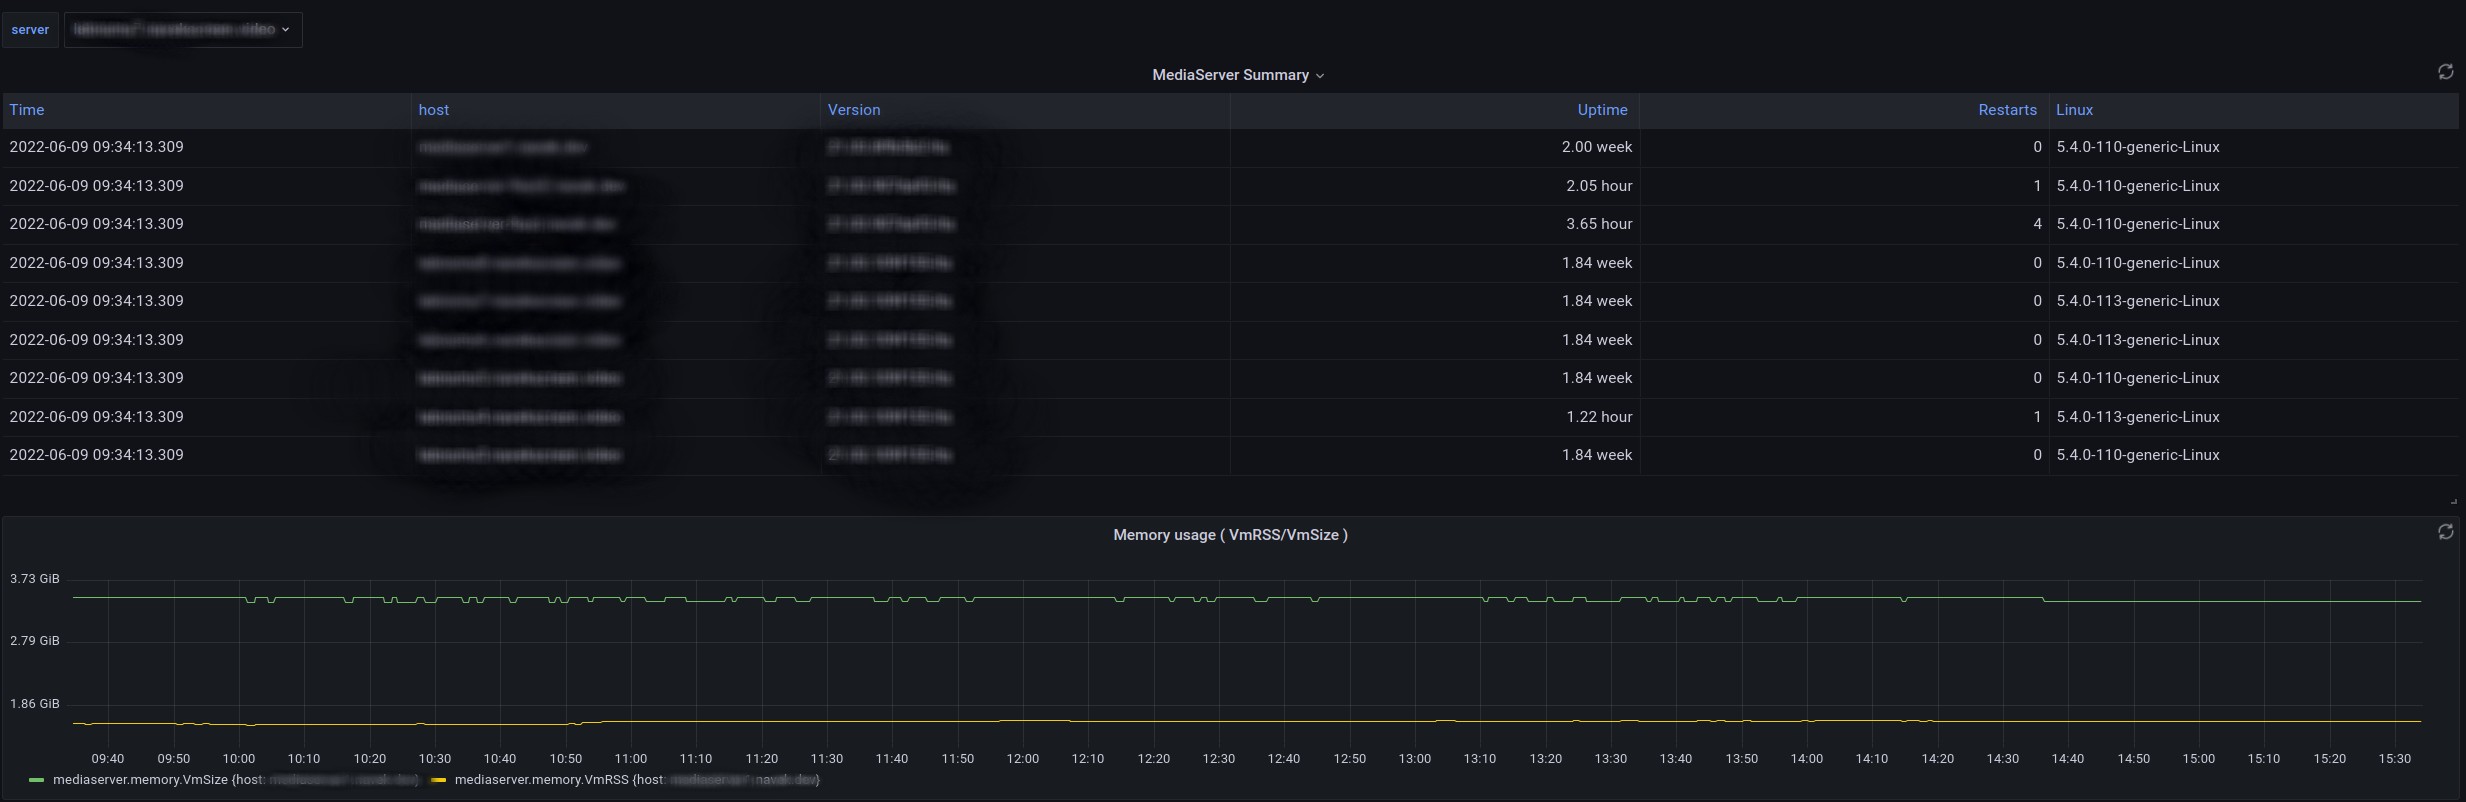
- Mediaserver summary
- current time
- mediaserver hostname
- mediaserver version
- mediaserver uptime
- number of mediaserver restarts
- OS version of host mediaserver is installed at
- Memory usage
- VmSize – size of available for use memory
- VmRss – size of used memory
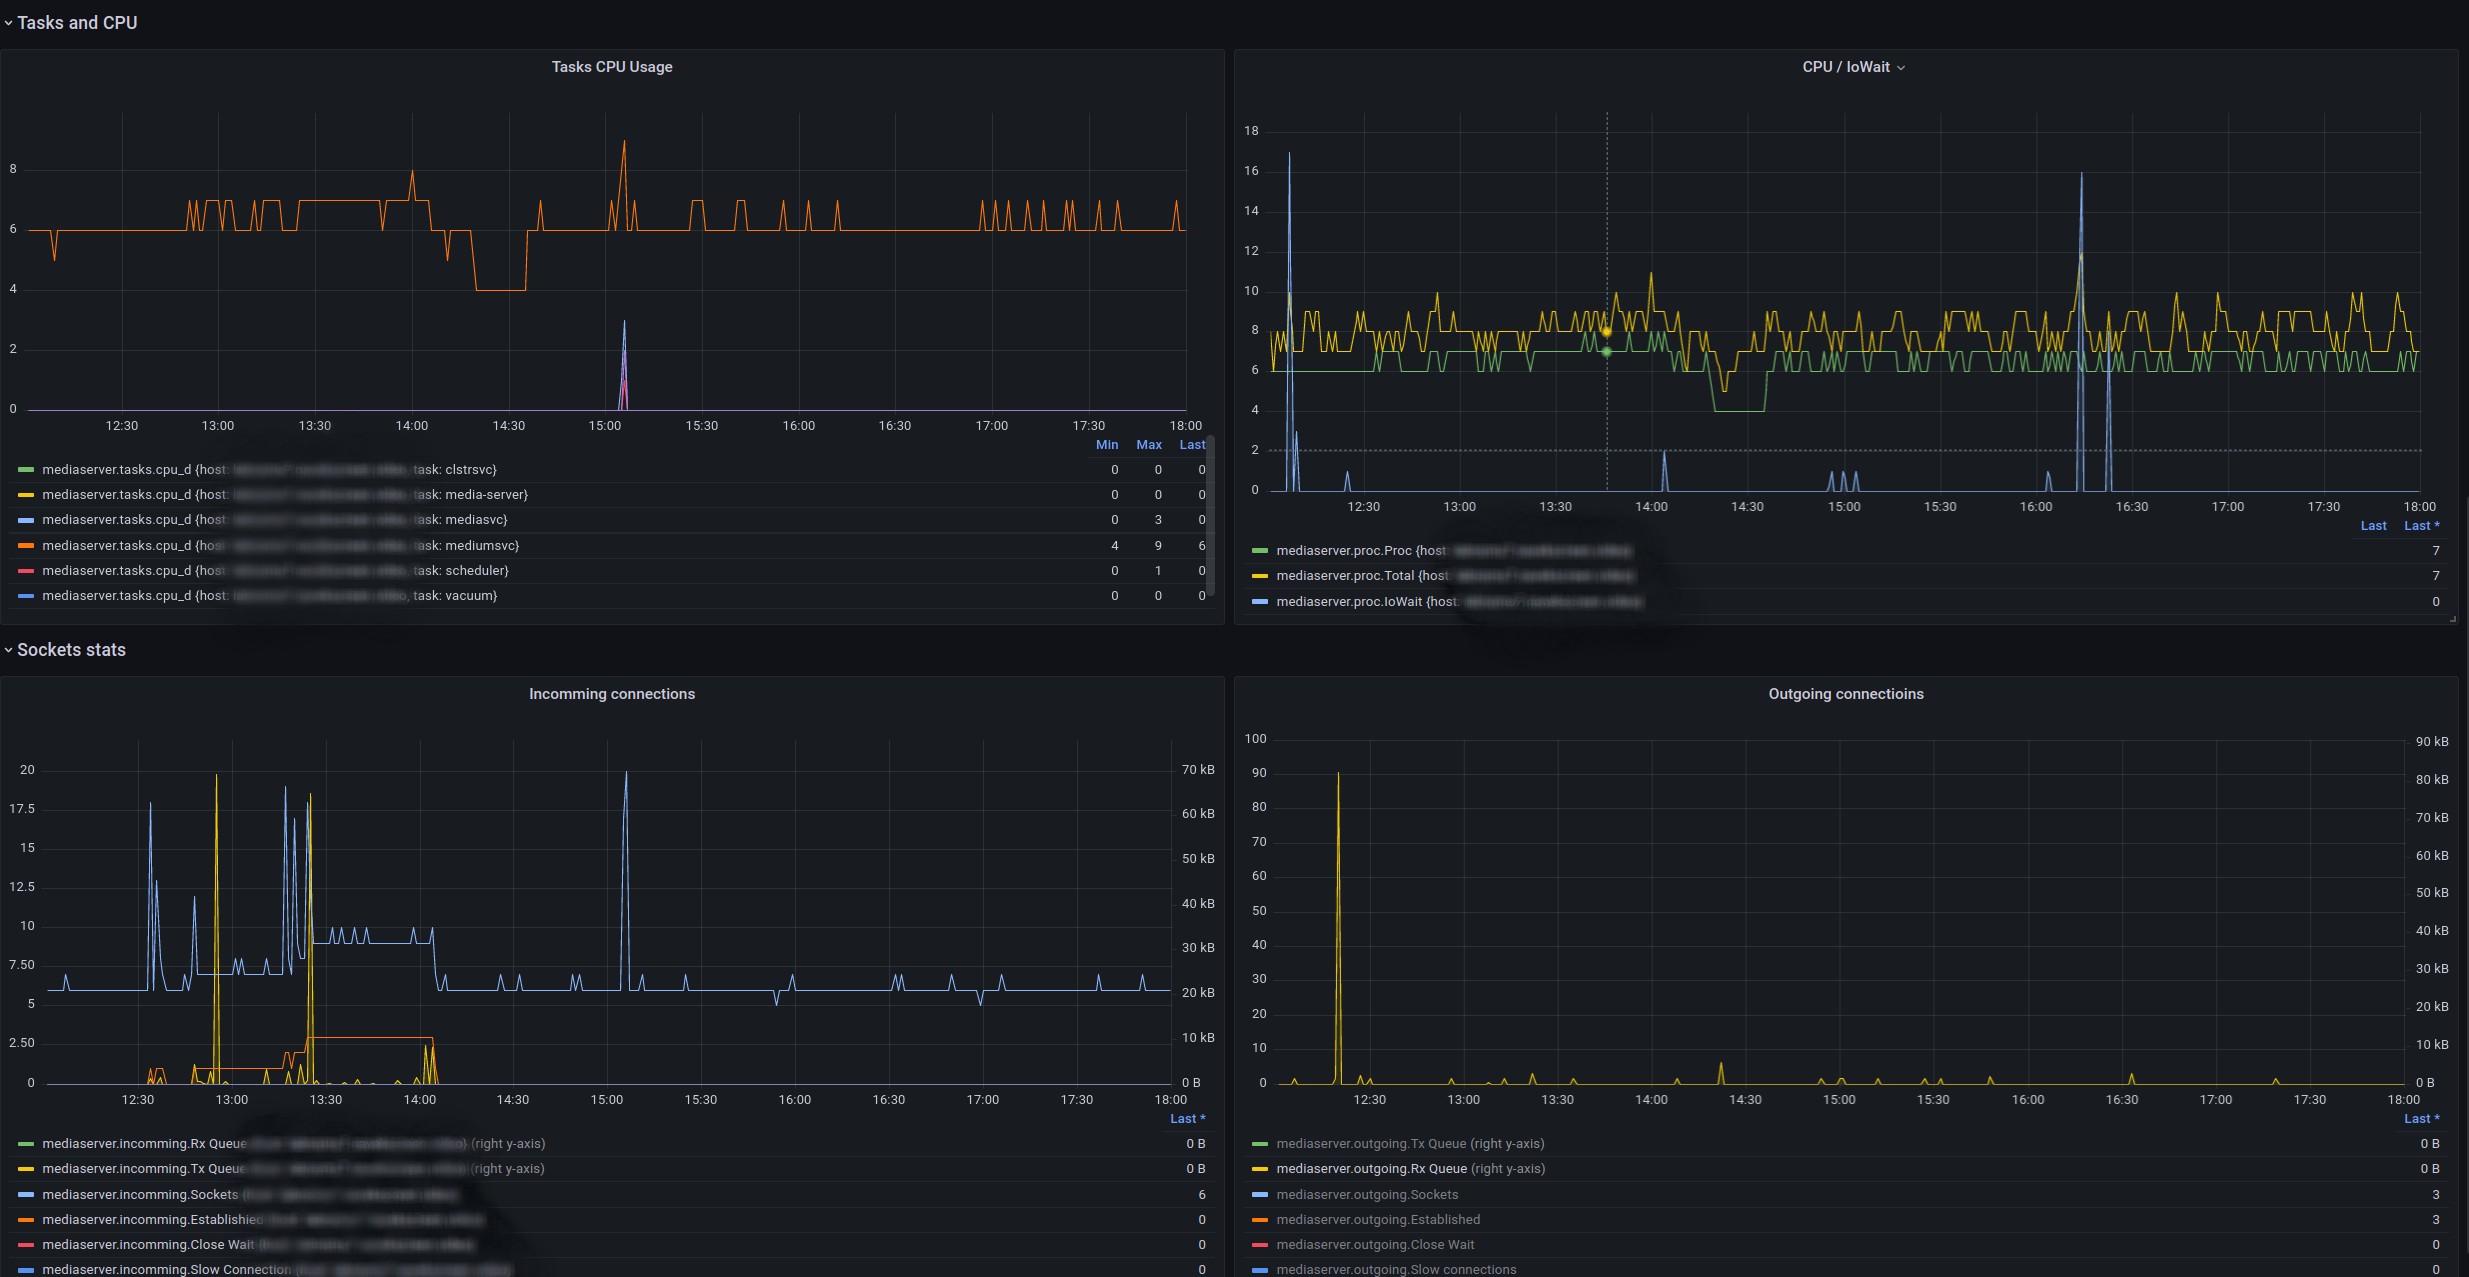
- Tasks usage
- mediasvc – customer service streams
- mediumsvc – streams capturing cameras
- websvc – API\Cpanel
- scheduler\vacuum\cluster – auxiliary
- CPU usage
- Sockets connections (incoming/outgoing)
- RxQueue – number of unreceived data
- TxQueue – send queue
- Sockets – total open sockets
- Established – number of established connections
- Close Wait – semi-closed connections
- Slow Connection – slow connections, delivery takes more than 100 milliseconds
Data source config
Collector type:
Collector plugins:
Collector config:
Revisions
Upload an updated version of an exported dashboard.json file from Grafana
| Revision | Description | Created | |
|---|---|---|---|
| Download |