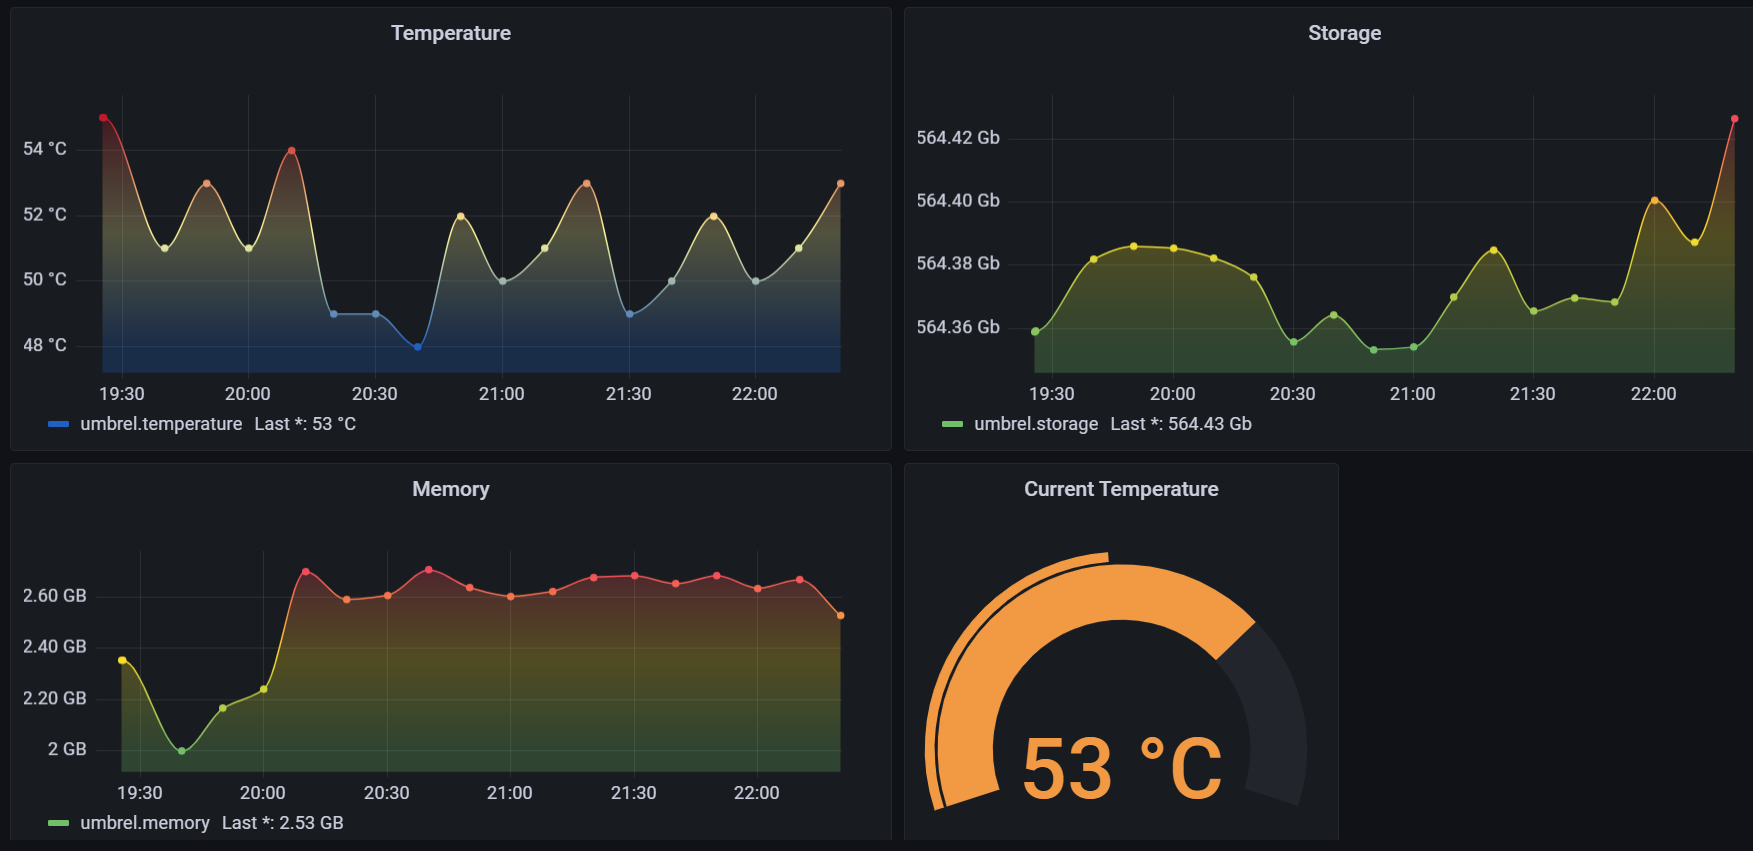
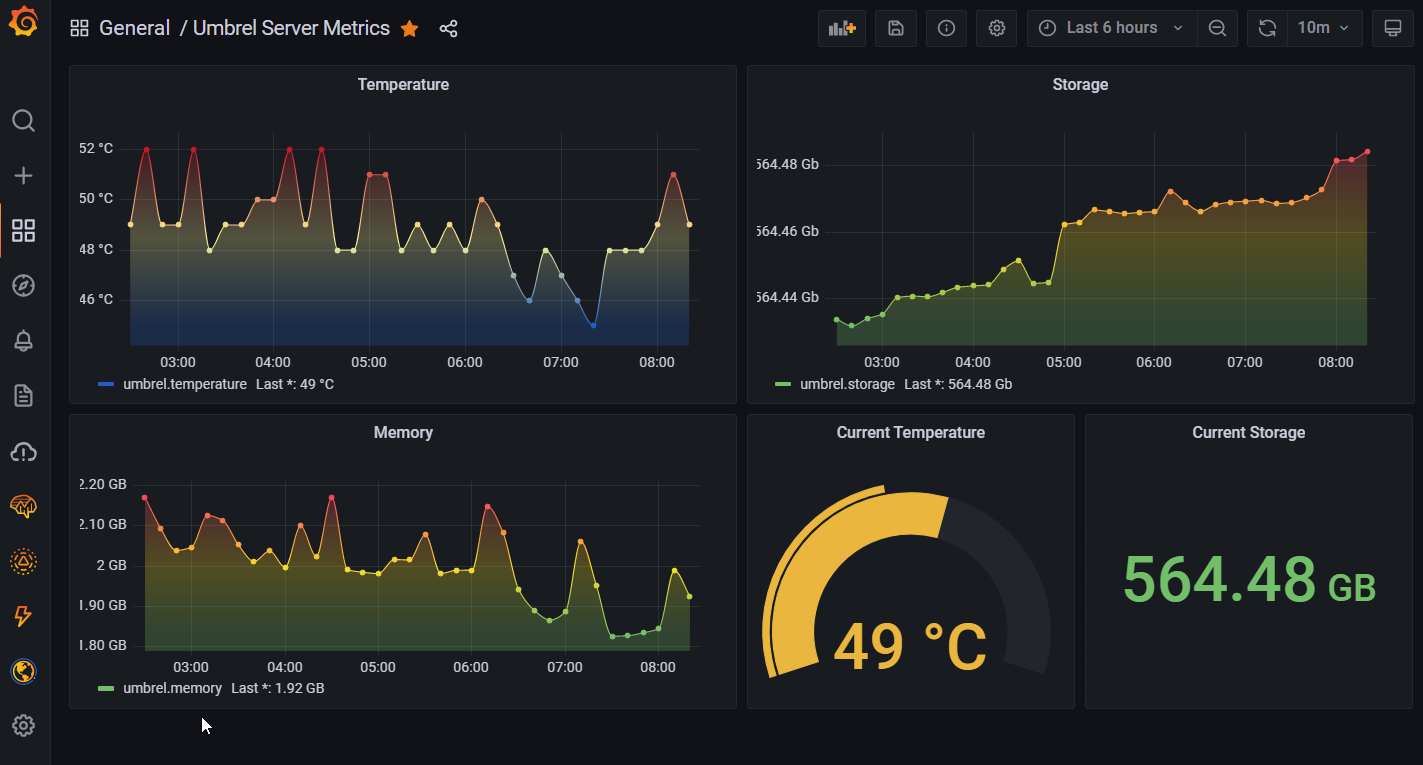
Umbrel Server Metrics
Monitor your Umbrel server's temperature, storage, and memory metrics using Grafana.
Data source config
Collector config:
Upload an updated version of an exported dashboard.json file from Grafana
| Revision | Description | Created | |
|---|---|---|---|
| Download |


