
2 - APM Service Details
Service details explaining the RED metrics and other insightful metrics from the Service and its Operations.
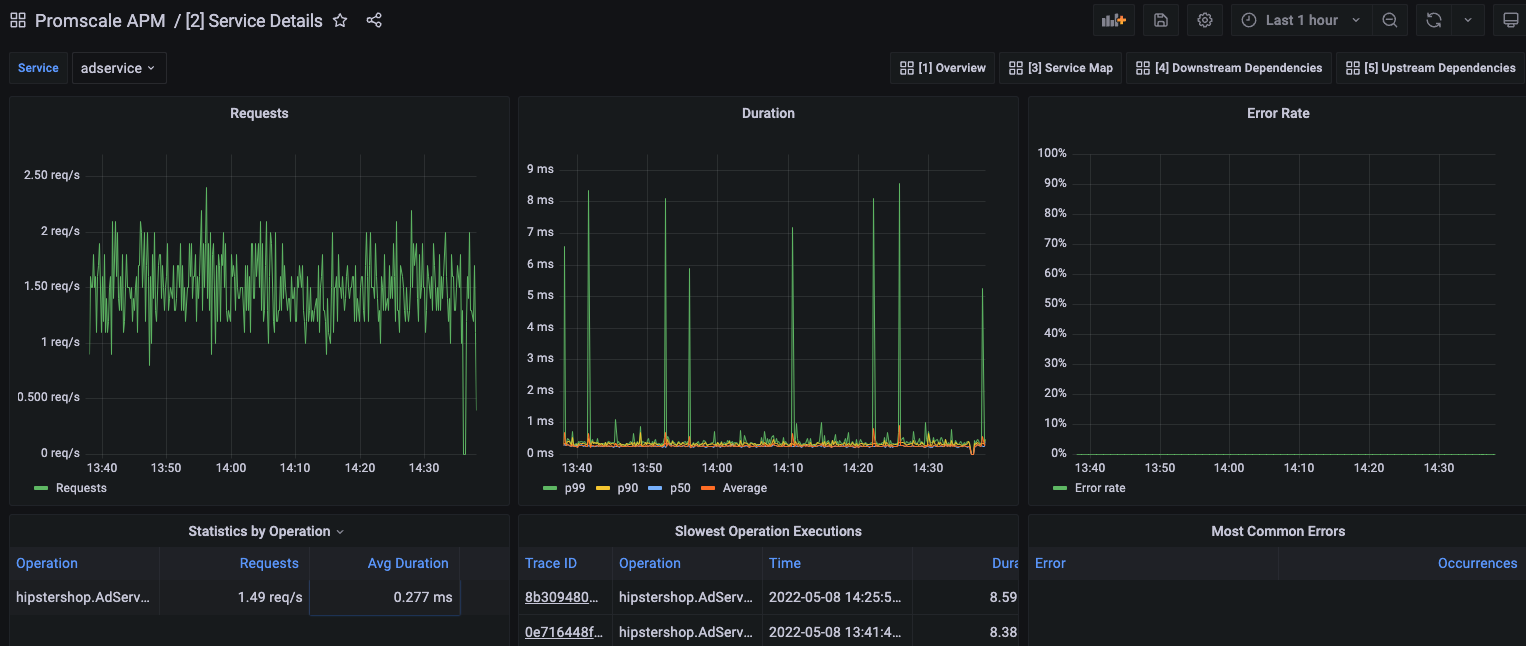
Service Details dashboard offered by Promscale on top of traces by leveraging SQL and TimescaleDB capabilities.
This dashboard contains details specific to a service:
- Requests rate.
- Duration of requests i.e. p99, p90, p50, and Average.
- Error rate.
- Statistics by Operations i.e. Requests rate per Operation.
- Slowest Operation Executions describing Trace ID, Operation, Timestamp, and Duration.
- Most Common Errors describing Errors and Occurrences.
Data source config
Collector type:
Collector plugins:
Collector config:
Revisions
Upload an updated version of an exported dashboard.json file from Grafana
| Revision | Description | Created | |
|---|---|---|---|
| Download |