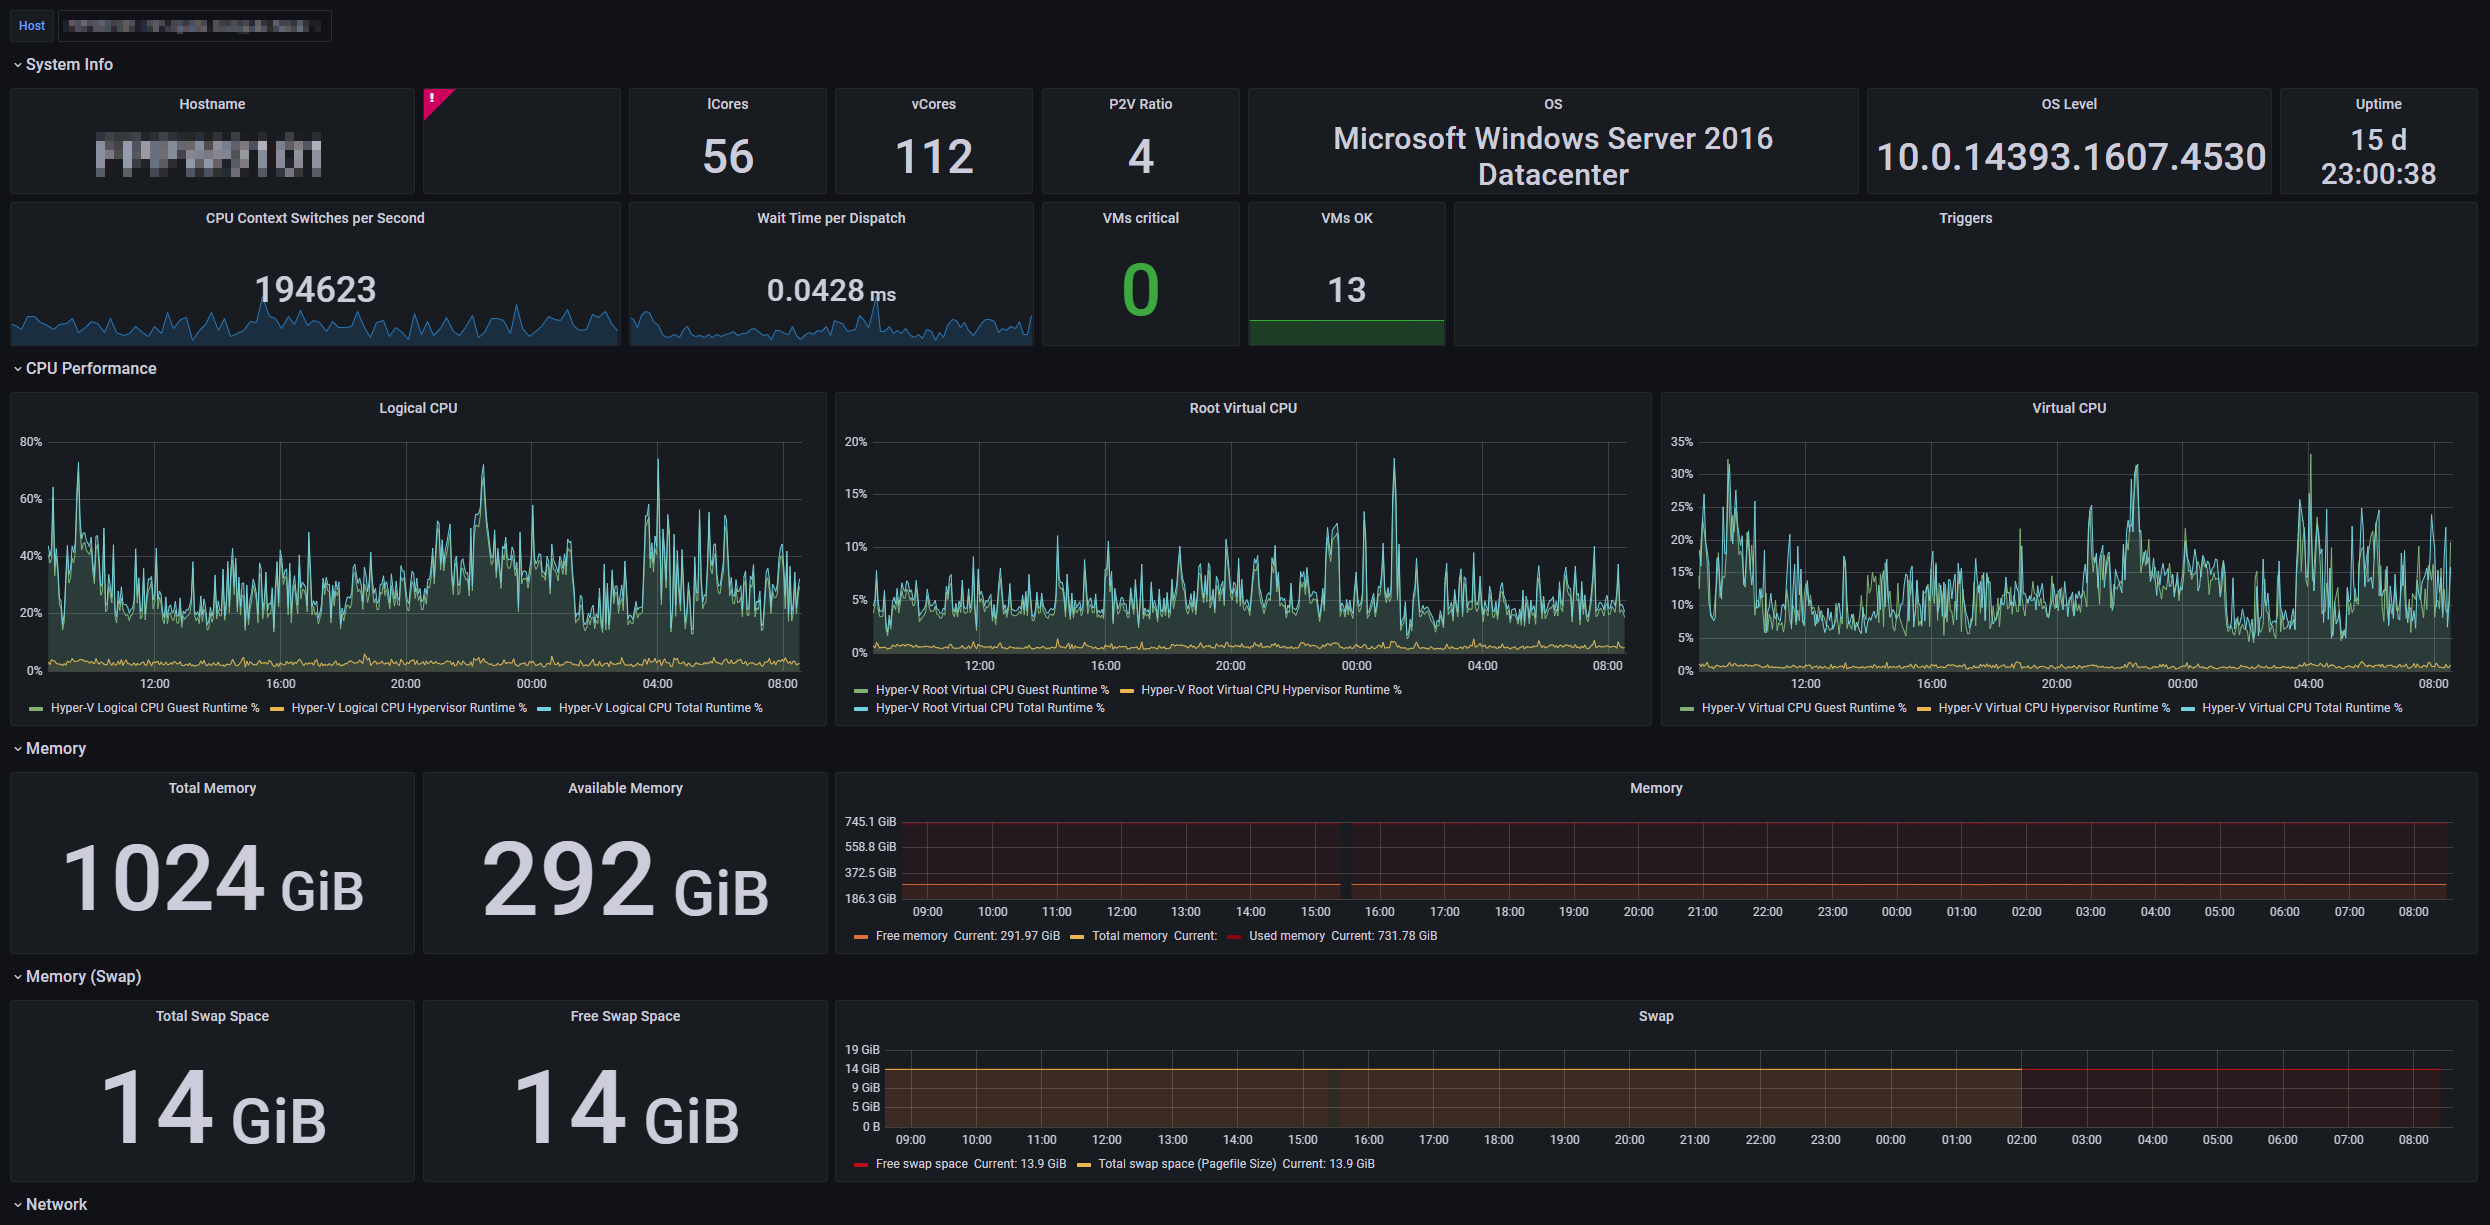
Windows - Fabric - Hyper-V (all Nodes) - TV
This dashboard is for checking all your Hyper-V nodes on the same time to quickly see peaks.
Data source config
Collector config:
Upload an updated version of an exported dashboard.json file from Grafana
| Revision | Description | Created | |
|---|---|---|---|
| Download |
Windows
Easily monitor your deployment of the Windows operating system with Grafana Cloud's out-of-the-box monitoring solution.
Learn more
