NGINX NAP BOT Dashboard
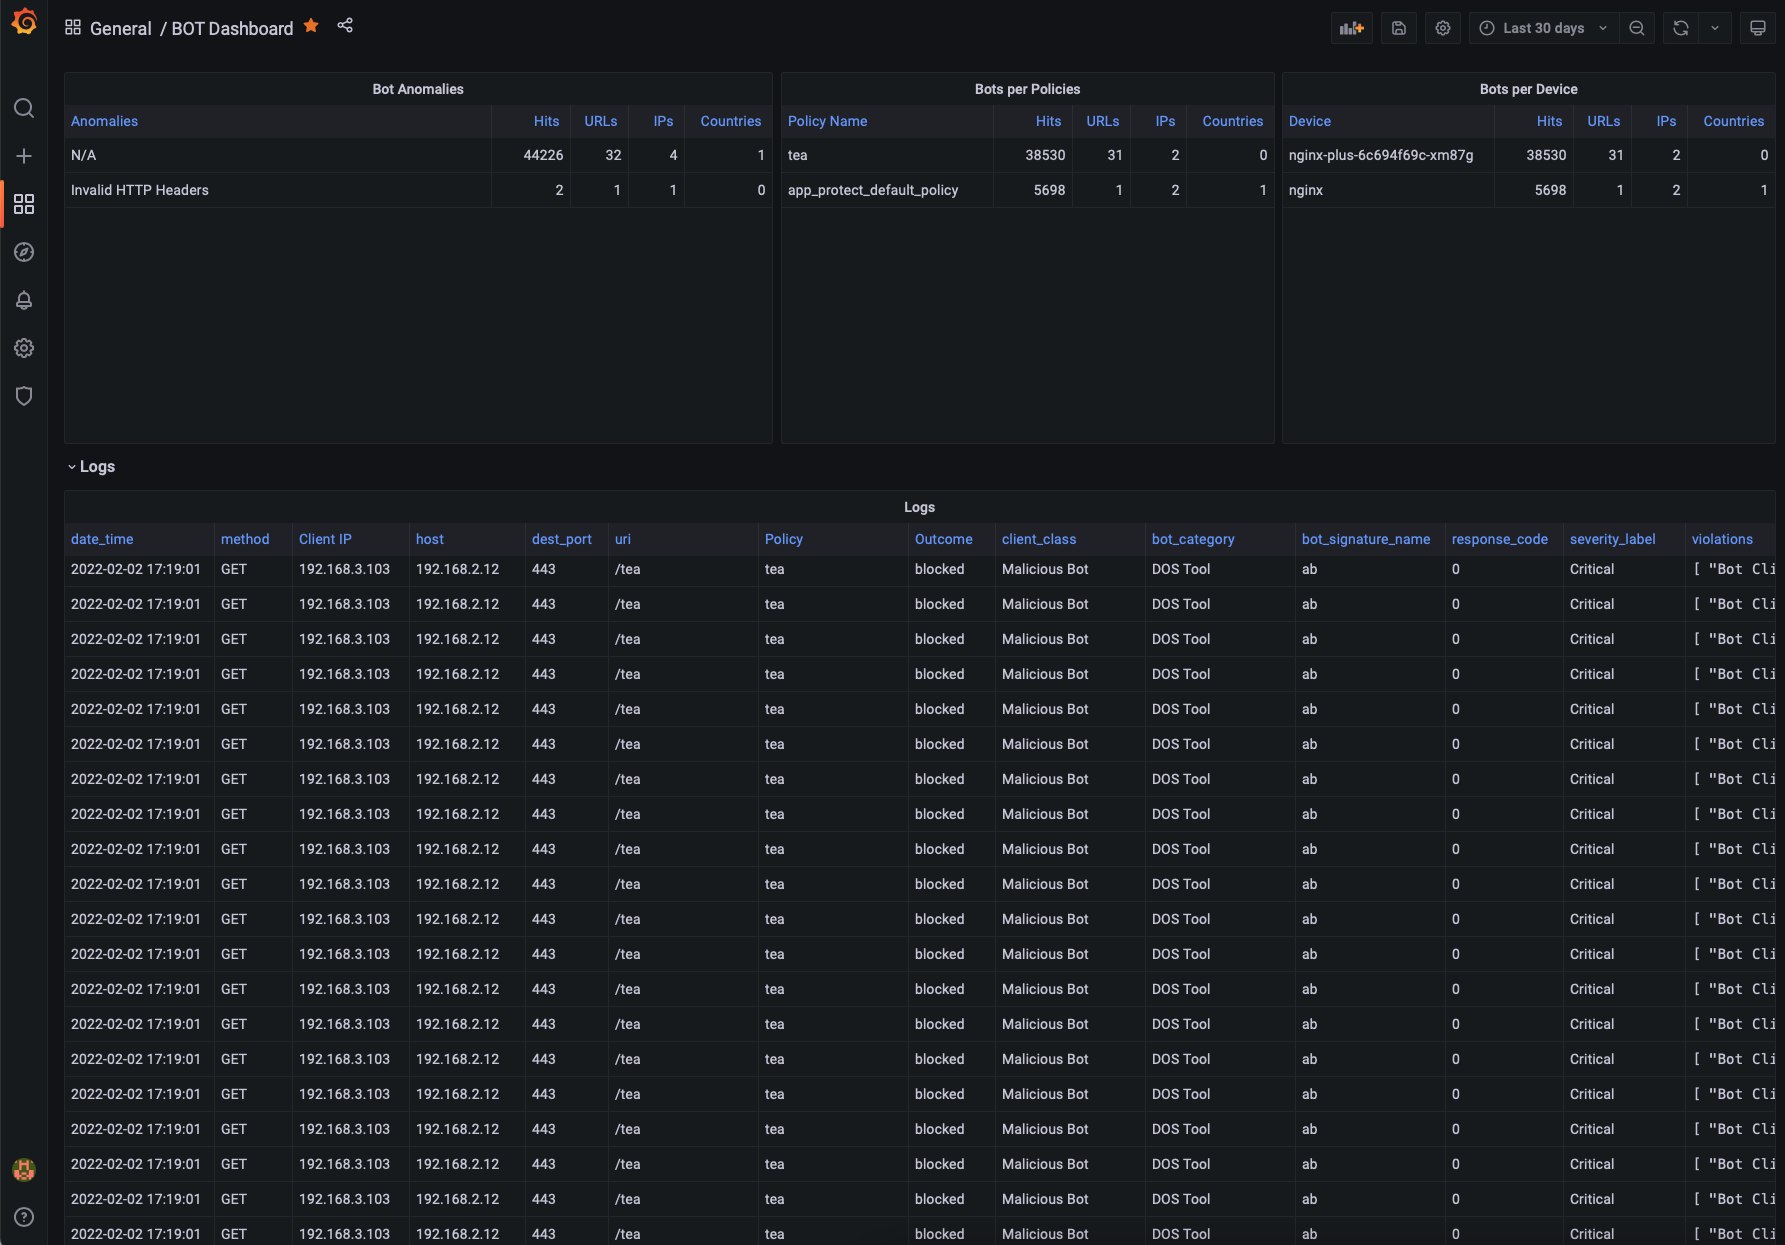
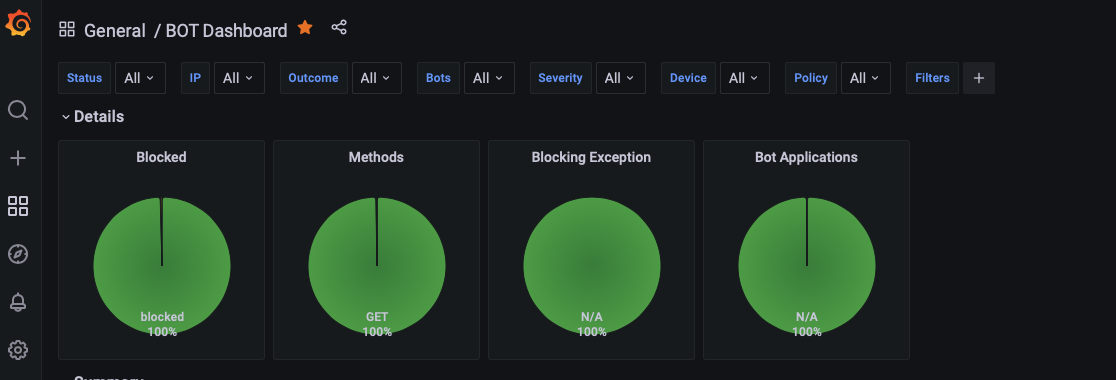
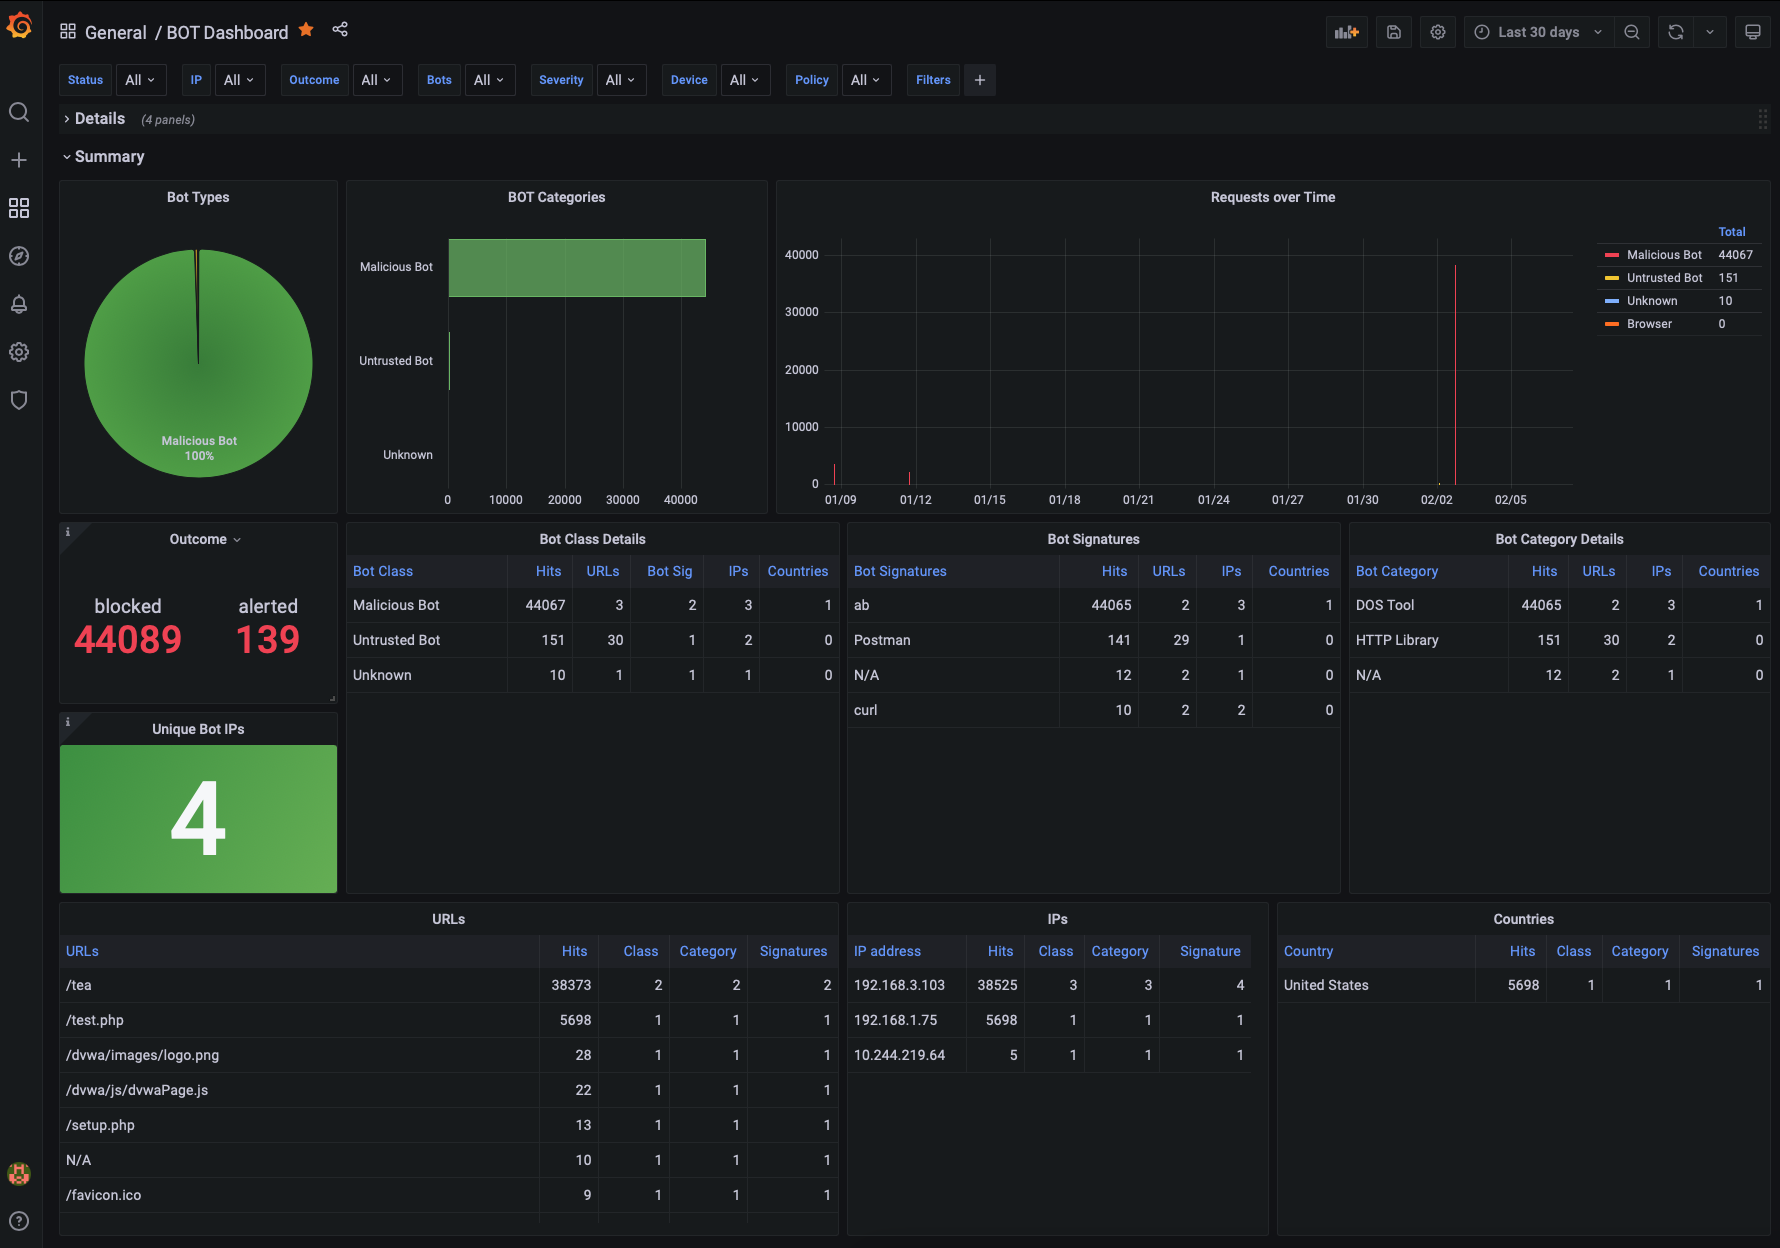
This Dashboard provides more visibility into the Bot logs generated by NGINX App Protect. This is part of a series of NGINX App Protect Dashboards
Please refer to the GitHub Repo for details on how to setup the entire solution that includes the following Dashboards:
- NAP Main Dashboard
- BOT Dashboard
- Attack Signatures Dashboard
- Support ID
- more
Data source config
Collector config:
Upload an updated version of an exported dashboard.json file from Grafana
| Revision | Description | Created | |
|---|---|---|---|
| Download |
NGINX
Easily monitor NGINX, an open source software for web serving, reverse proxying, caching, load balancing, media streaming, and more, with Grafana Cloud's out-of-the-box monitoring solution.
Learn more


