Mattermost Performance Monitoring v2
A dashboard to monitor complete Mattermost application performance
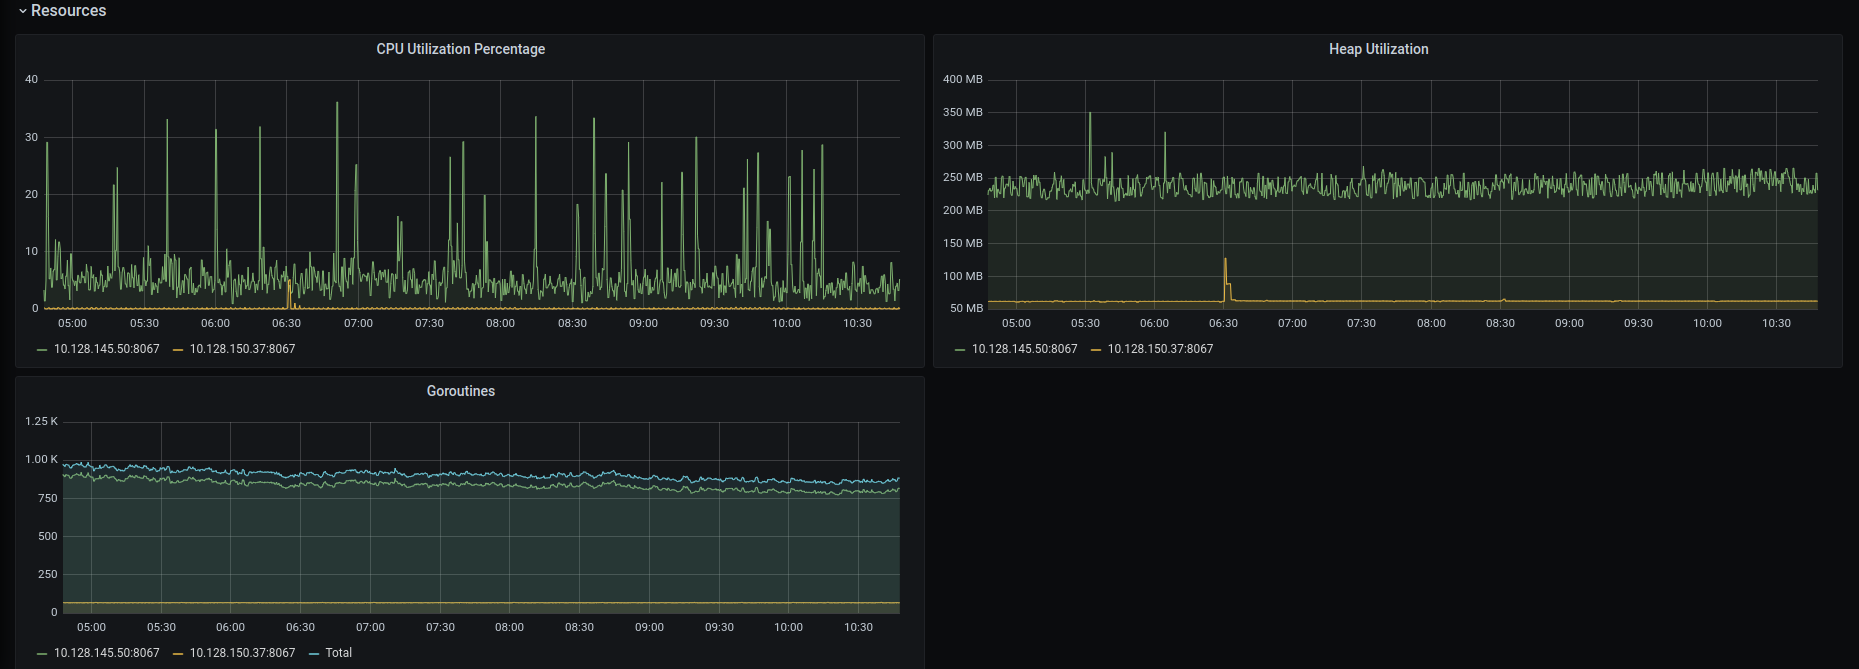
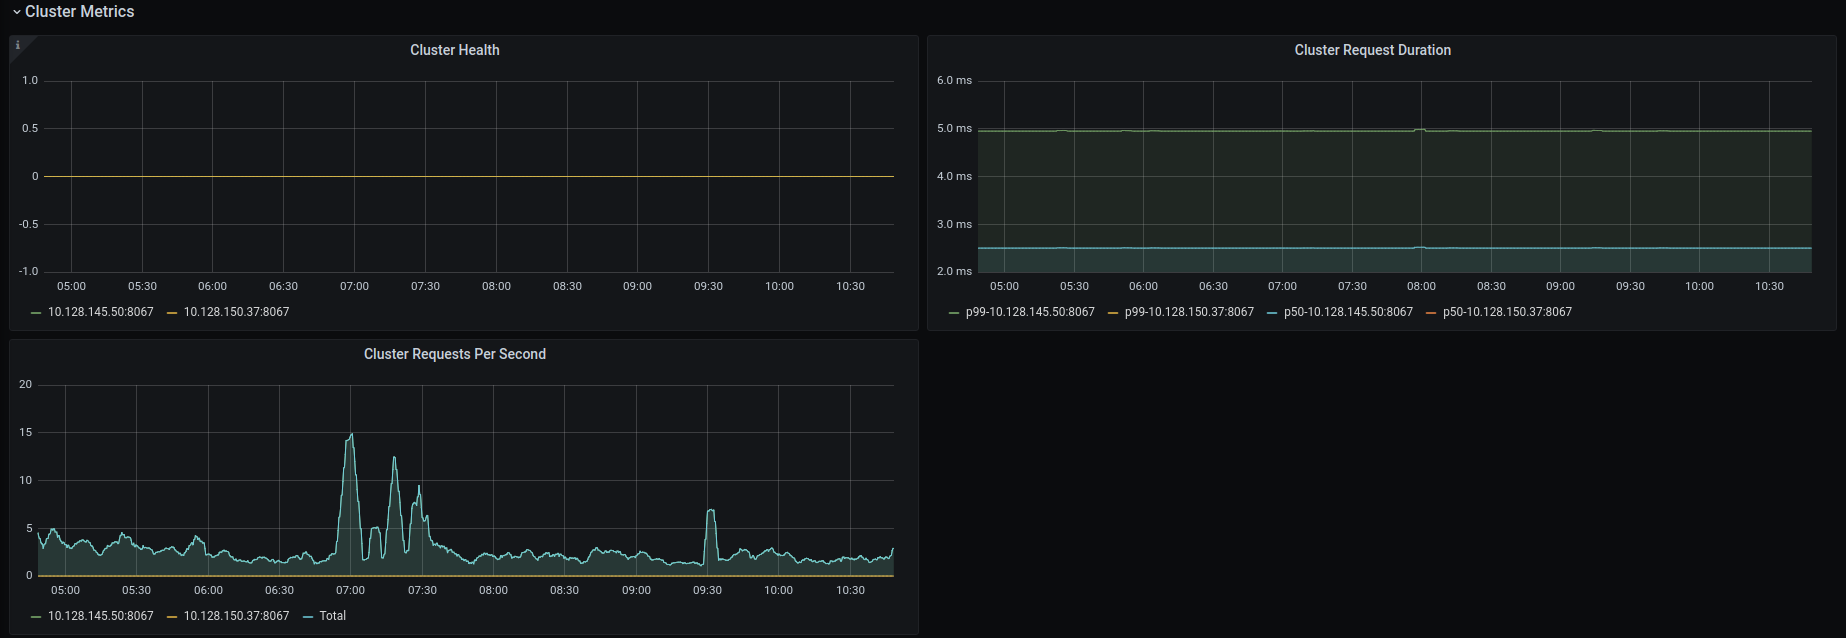
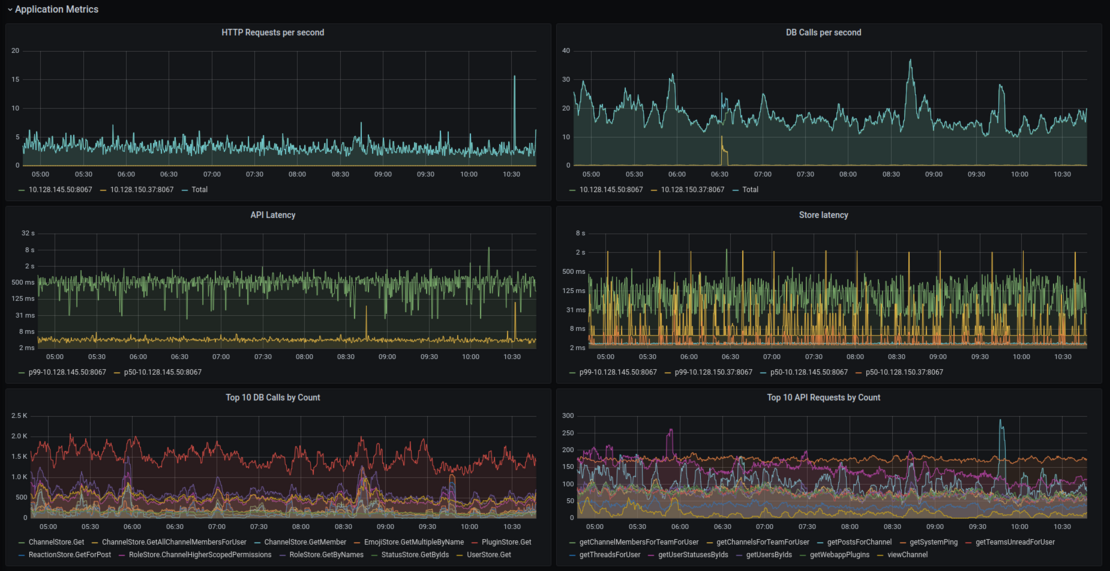
This dashboard gives a comprehensive overview of the entire Mattermost application. The metrics are divided into 4 sections:
- Application metrics
- Cluster metrics
- Job server
- System metrics
For more information on how to configure Mattermost to collect metrics, visit the Mattermost documentation.
Report issues or feedback in the Mattermost forums or join the discussion in the public Developers Performance channel.
Data source config
Collector type:
Collector plugins:
Collector config:
Revisions
Upload an updated version of an exported dashboard.json file from Grafana
| Revision | Description | Created | |
|---|---|---|---|
| Download |


