
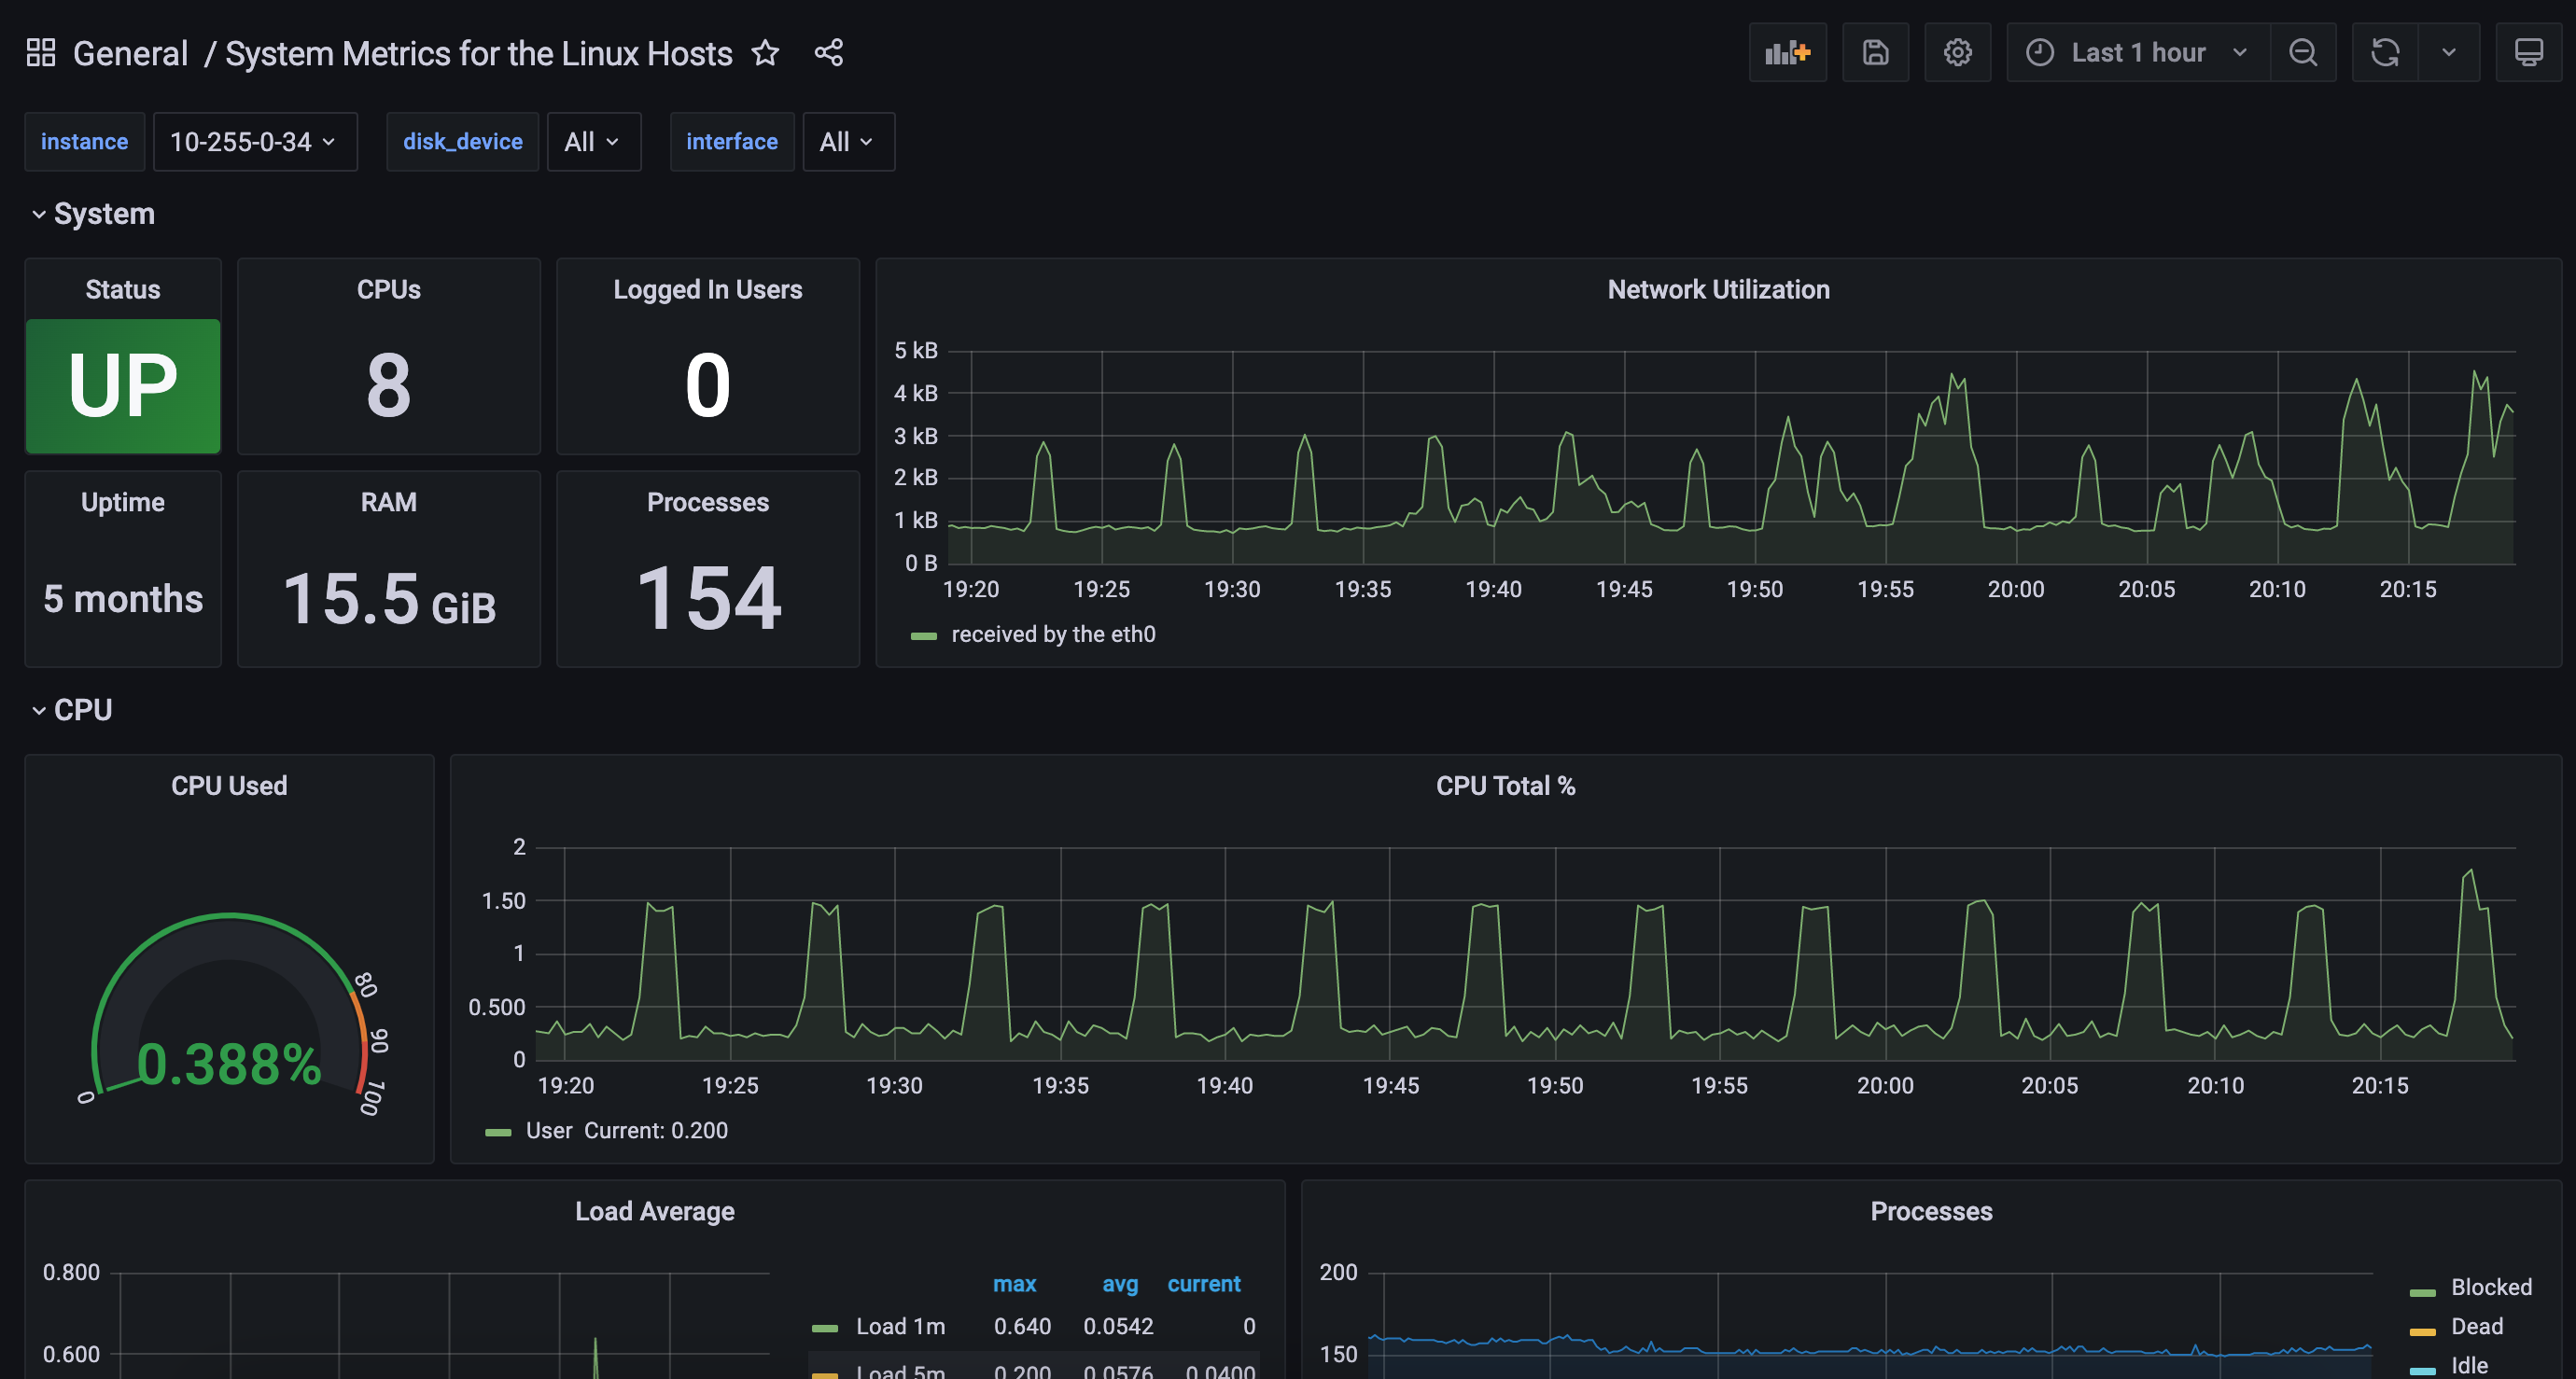
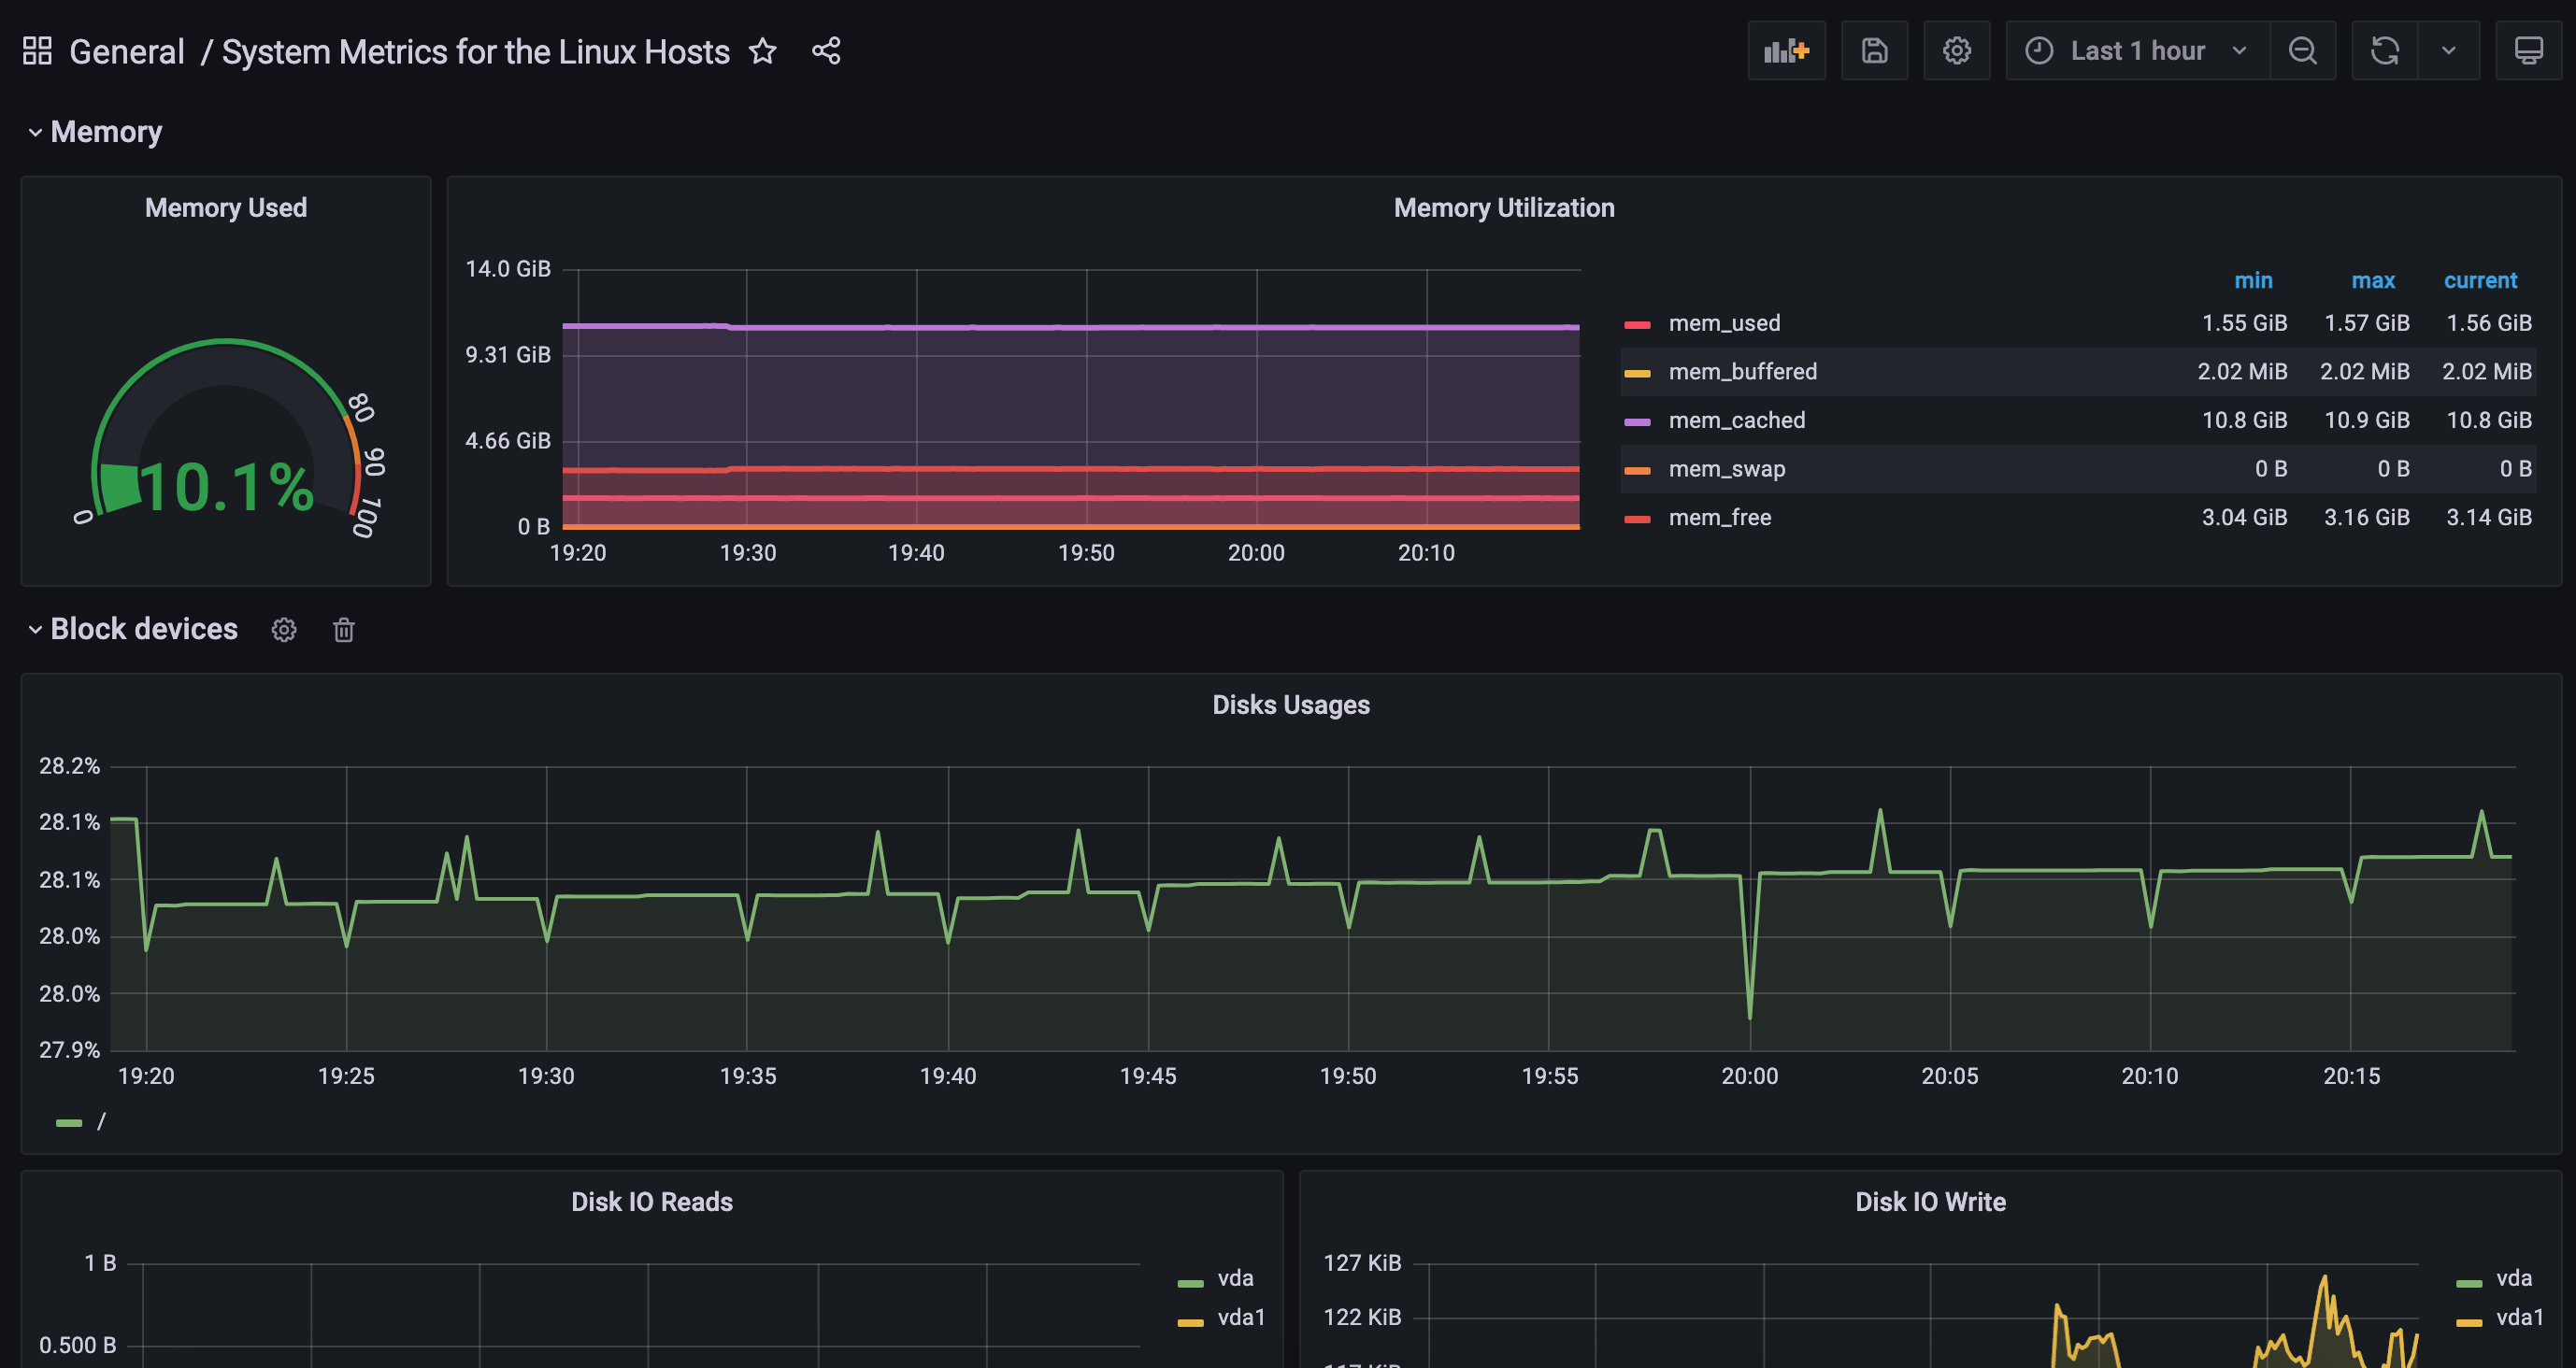
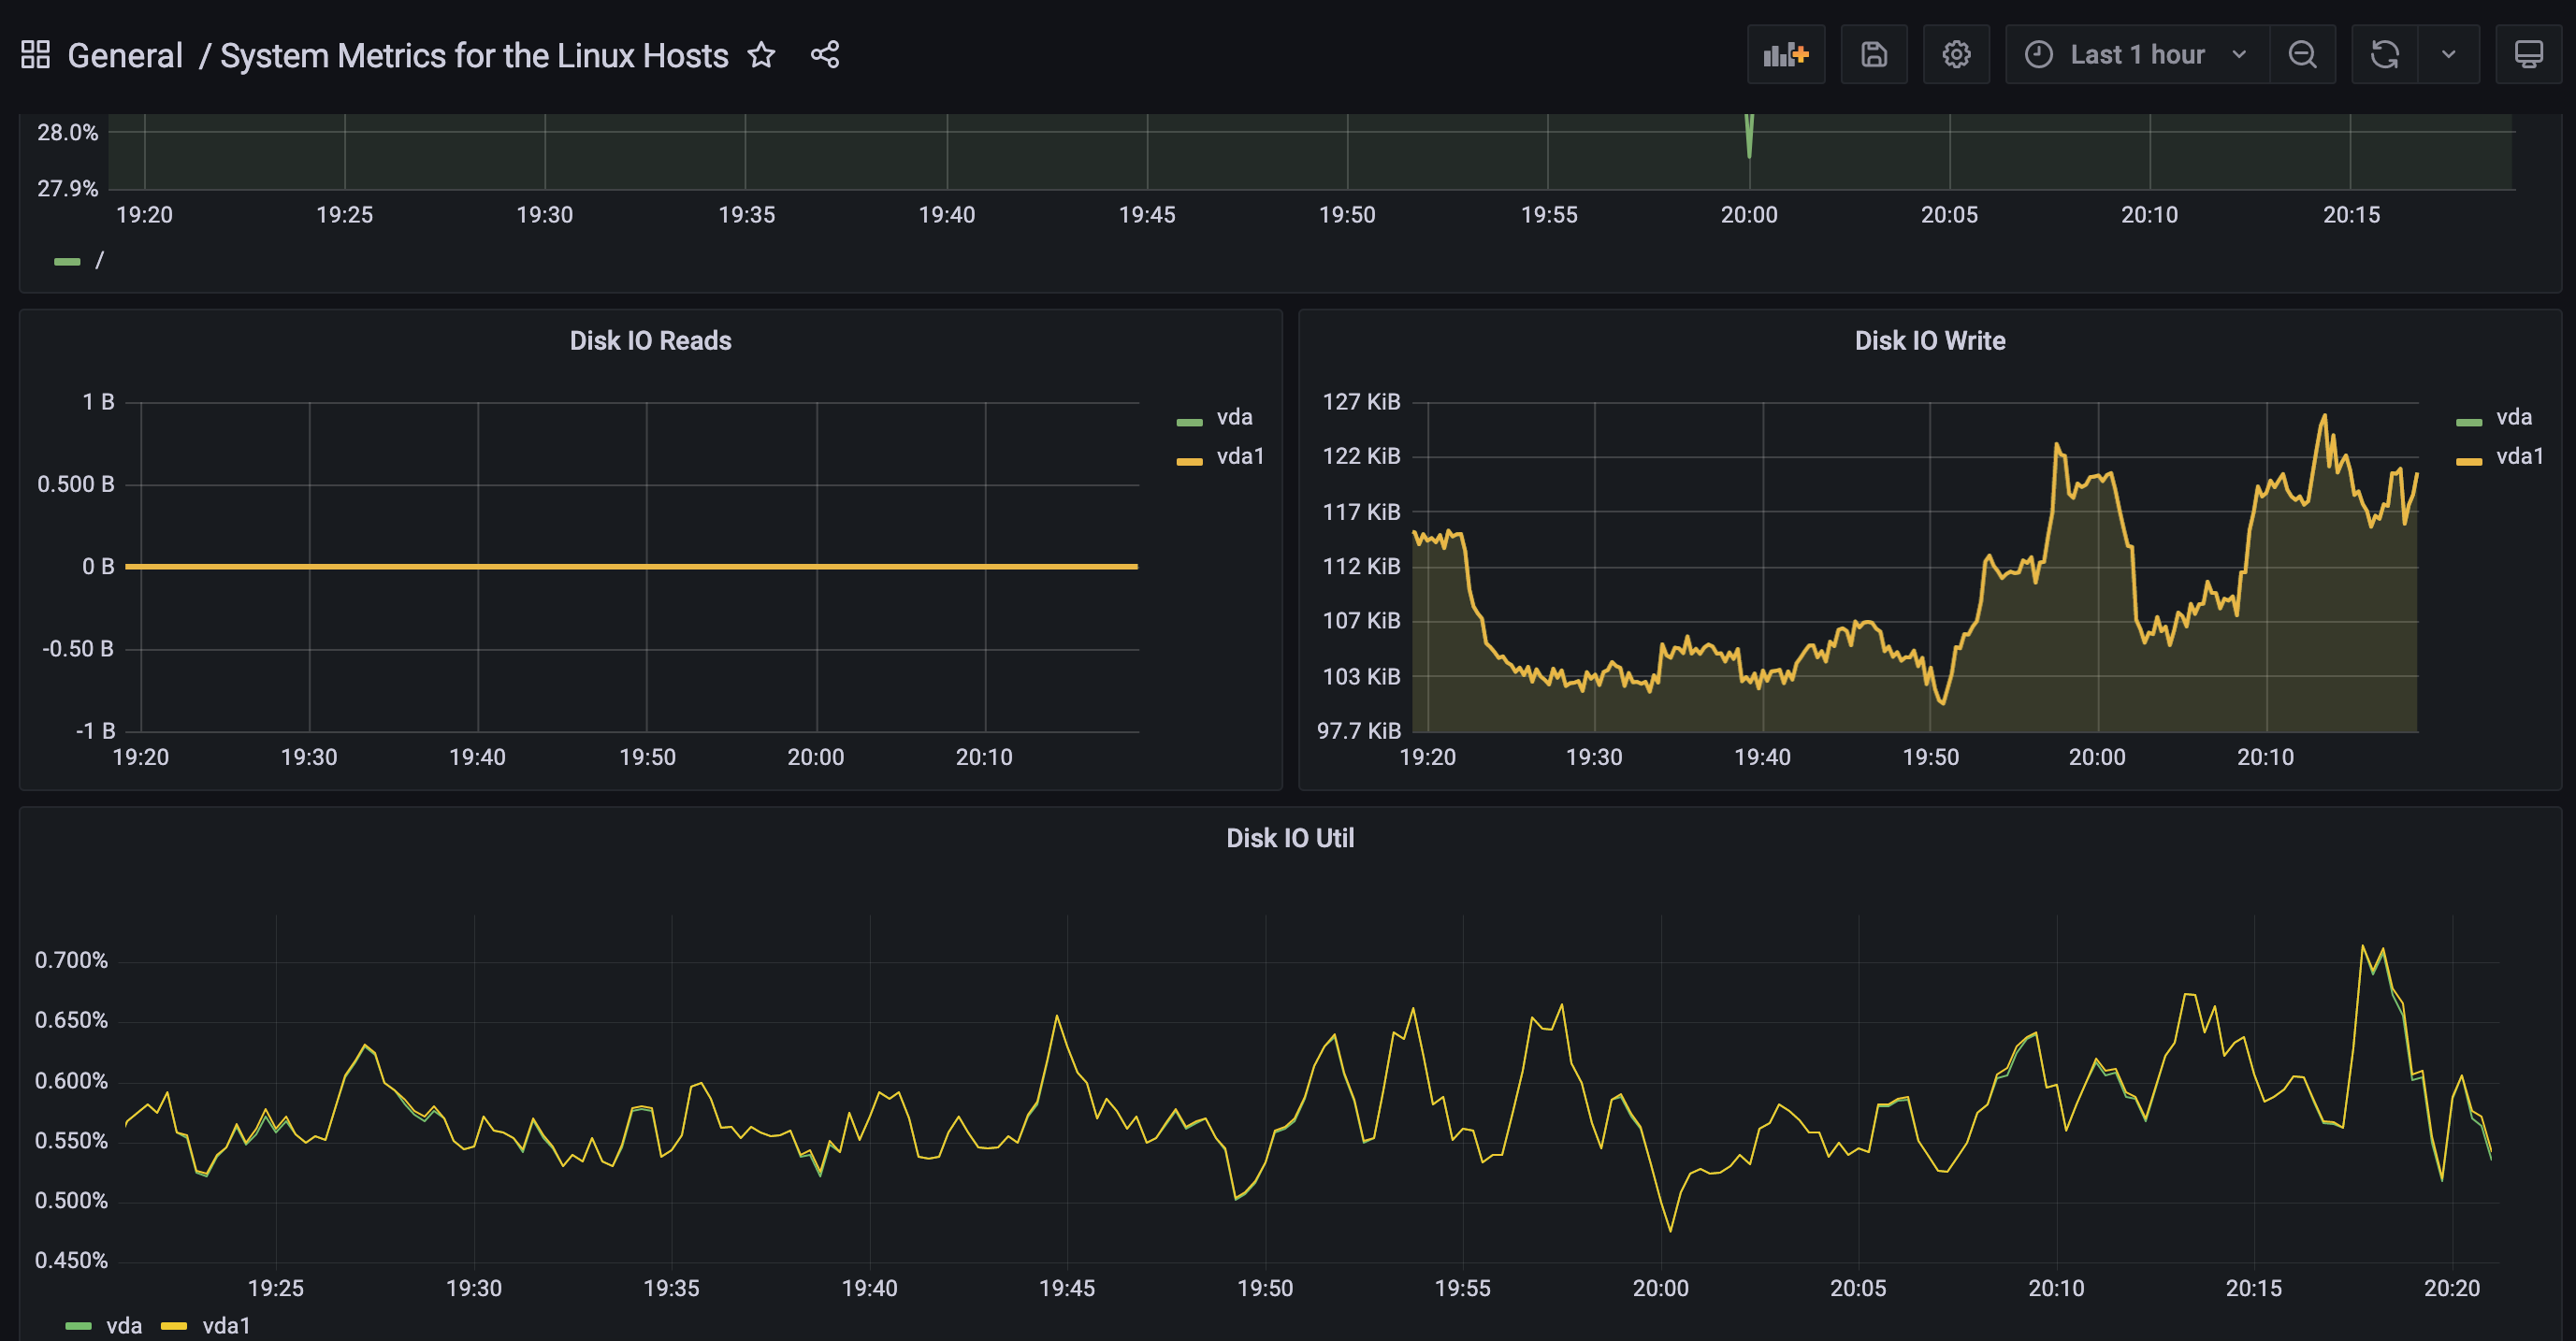
System Metrics for the Linux Hosts
Monitoring Linux Hosts via telegraf agent.
- use Telegraf as agent
- use Prometheus as DataSource
- for nightingale users
Data source config
Collector type:
Collector plugins:
Collector config:
Revisions
Upload an updated version of an exported dashboard.json file from Grafana
| Revision | Description | Created | |
|---|---|---|---|
| Download |
Linux Server
Monitor Linux with Grafana. Easily monitor your Linux deployment with Grafana Cloud's out-of-the-box monitoring solution.
Learn more