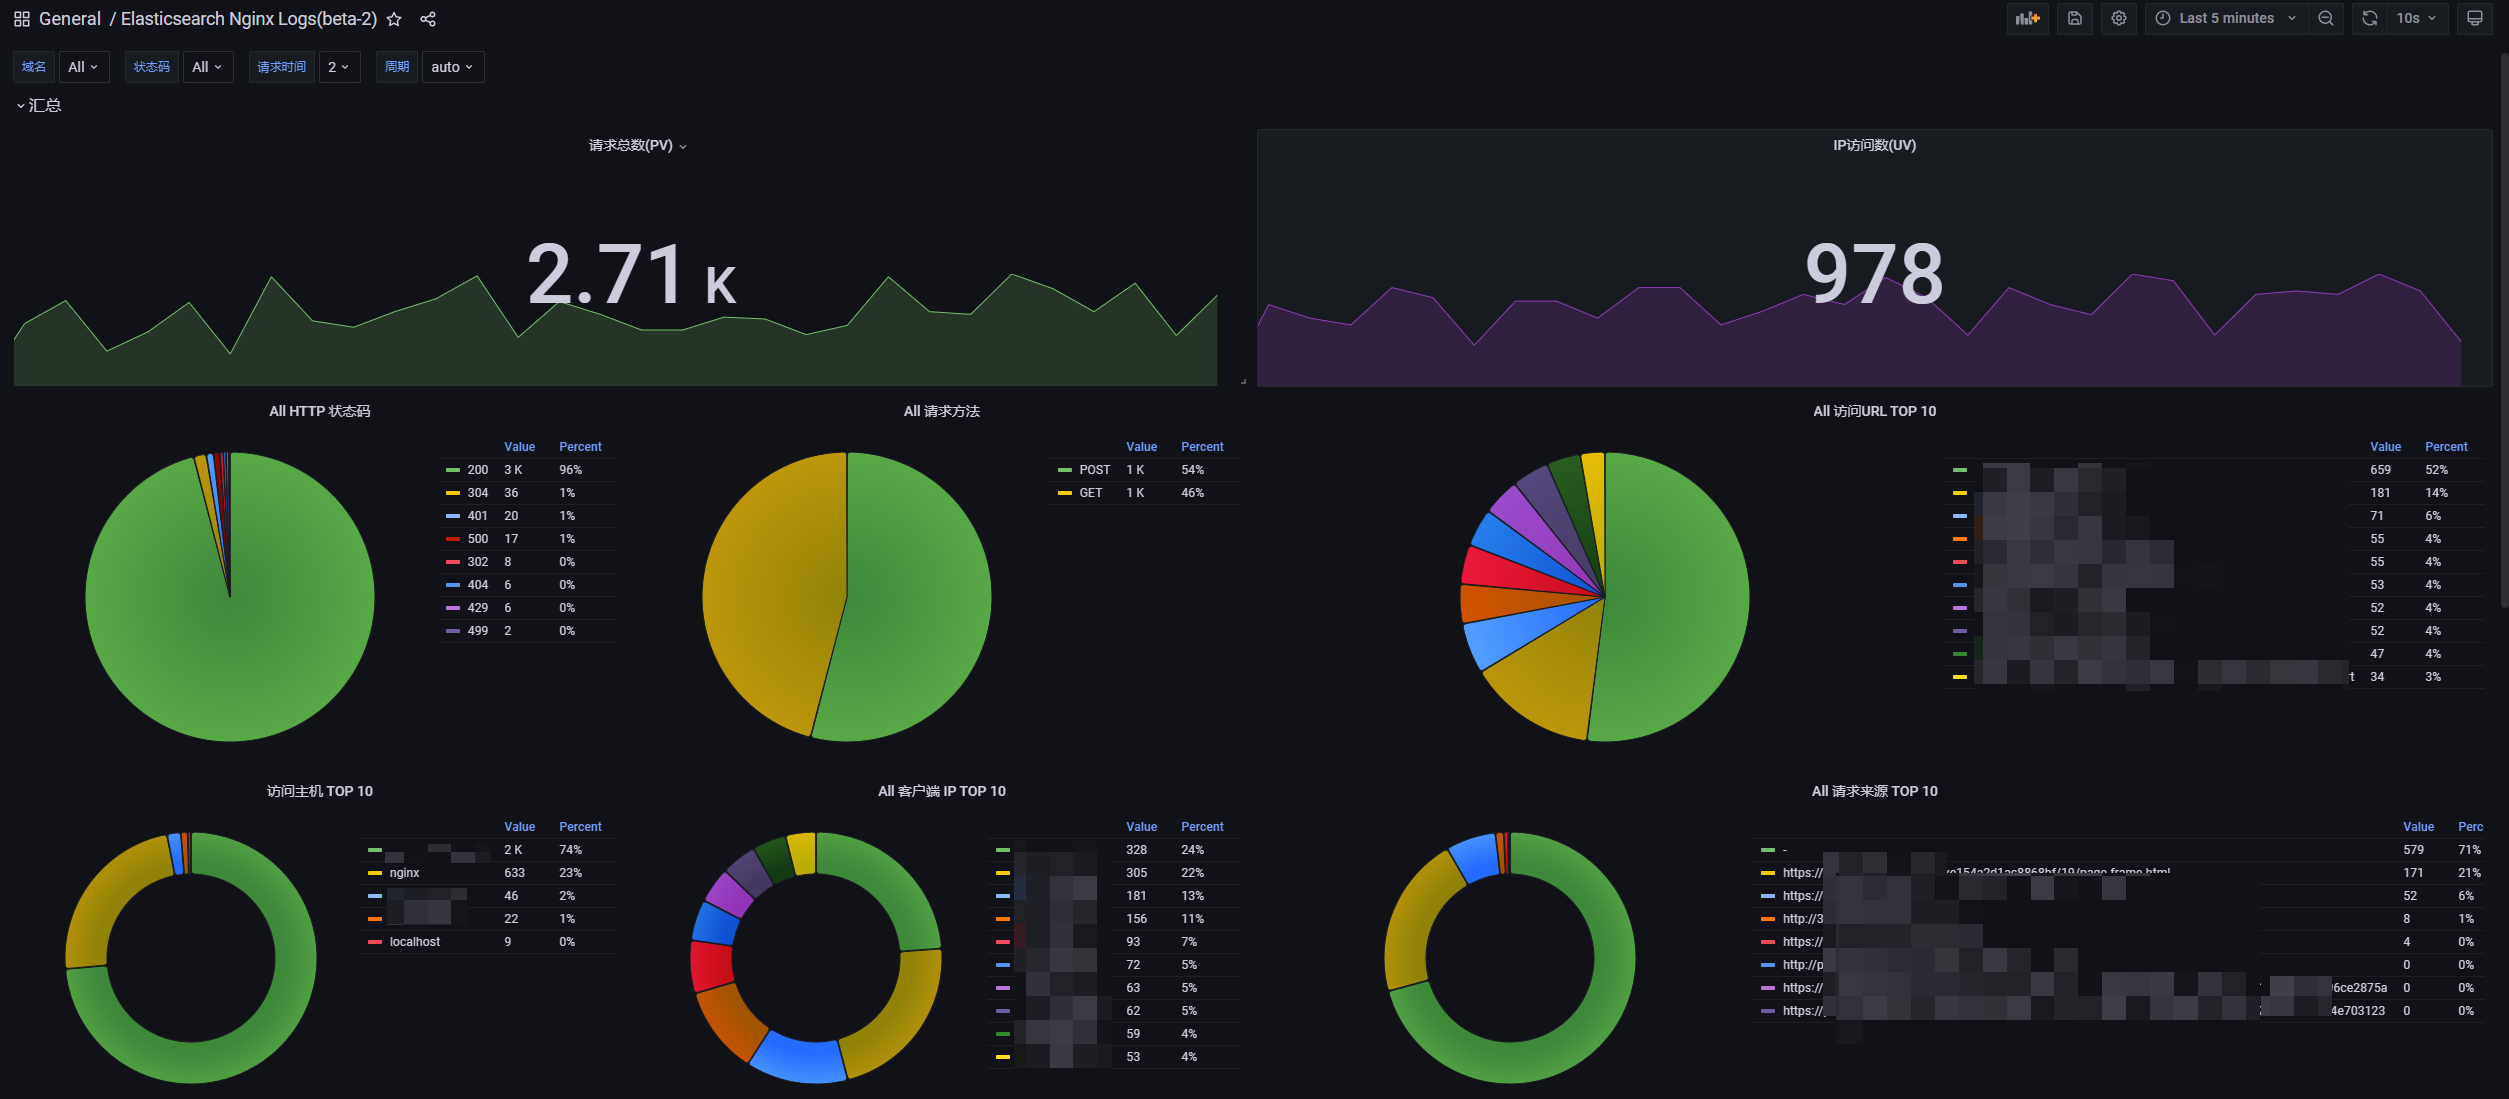
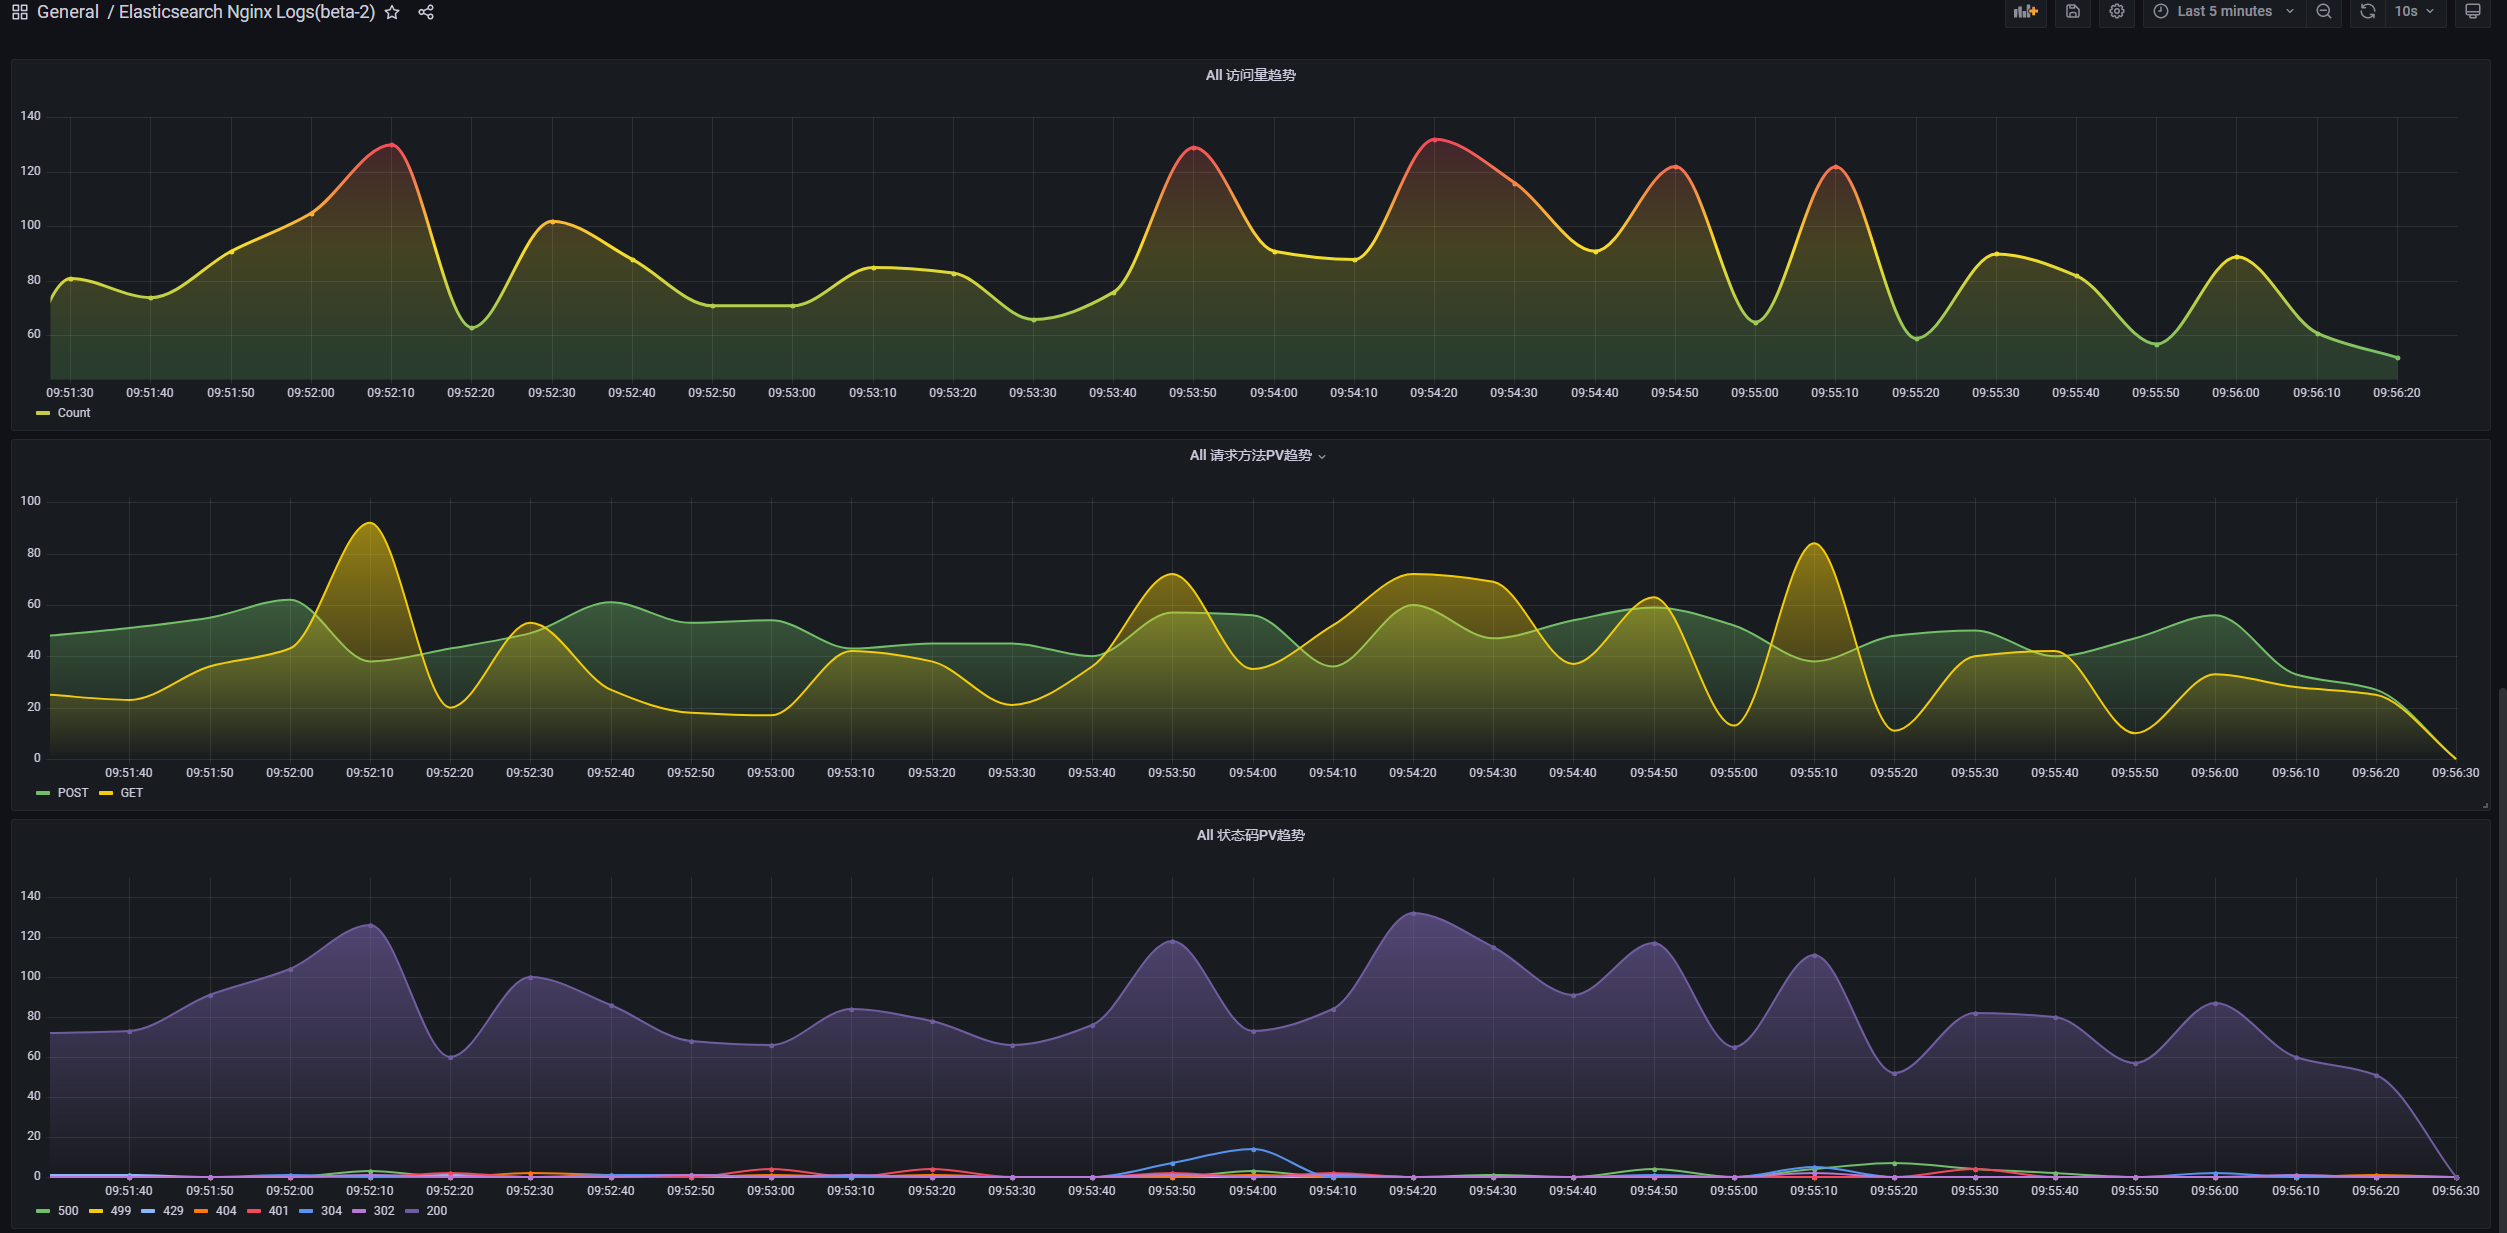
嗯嗯......
Collector Configuration Details
Nginx
Nginx日志规范化输出,通过 filebeat 工具解析发送到 Elasticsearch ,通过 Grafana 展示
自定义 nginx 日志配置,输出为json格式 -
nginx.conf
user nginx; worker_processes auto; error_log /var/log/nginx/error.log warn; pid /var/run/nginx.pid; events { worker_connections 10240; } http { include /etc/nginx/mime.types; default_type application/octet-stream; log_format json '{"@timestamp":"$time_iso8601",' '"server_addr":"$server_addr",' '"server_name":"$server_name",' '"server_port":"$server_port",' '"server_protocol":"$server_protocol",' '"client_ip":"$remote_addr",' '"client_user":"$remote_user",' '"status":"$status",' '"request_method": "$request_method",' '"request_length":"$request_length",' '"request_time":"$request_time",' '"request_url":"$request_uri",' '"request_line":"$request",' '"send_client_size":"$bytes_sent",' '"send_client_body_size":"$body_bytes_sent",' '"proxy_protocol_addr":"$proxy_protocol_addr",' '"proxy_add_x_forward":"$proxy_add_x_forwarded_for",' '"proxy_port":"$proxy_port",' '"proxy_host":"$proxy_host",' '"upstream_host":"$upstream_addr",' '"upstream_status":"$upstream_status",' '"upstream_cache_status":"$upstream_cache_status",' '"upstream_connect_time":"$upstream_connect_time",' '"upstream_response_time":"$upstream_response_time",' '"upstream_header_time":"$upstream_header_time",' '"upstream_cookie_name":"$upstream_cookie_name",' '"upstream_response_length":"$upstream_response_length",' '"upstream_bytes_received":"$upstream_bytes_received",' '"upstream_bytes_sent":"$upstream_bytes_sent",' '"http_host":"$host",' '"http_cookie":"$http_cooke",' '"http_user_agent":"$http_user_agent",' '"http_origin":"$http_origin",' '"http_upgrade":"$http_upgrade",' '"http_referer":"$http_referer",' '"http_x_forward":"$http_x_forwarded_for",' '"http_x_forwarded_proto":"$http_x_forwarded_proto",' '"https":"$https",' '"http_scheme":"$scheme",' '"invalid_referer":"$invalid_referer",' '"slice_range":"$slice_range",' '"gzip_ratio":"$gzip_ratio",' '"realpath_root":"$realpath_root",' '"document_root":"$document_root",' '"is_args":"$is_args",' '"args":"$args",' '"connection_requests":"$connection_requests",' '"connection_number":"$connection",' '"ssl_protocol":"$ssl_protocol",' '"ssl_cipher":"$ssl_cipher"}'; access_log /var/log/nginx/access.log json; sendfile on; keepalive_timeout 65; include /etc/nginx/conf.d/*.conf; }
使用 docker-compose 启动时,指定挂载配置文件路径 -
docker-compose.yaml
version: '3' services: nginx: container_name: nginx image: nginx:1.20.1-alpine mem_limit: 128M restart: always volumes: # 这行配置 - ./volume/nginx/config/nginx_conf:/etc/nginx/nginx.conf ports: - 80:80 - 443:443
准备 elasticsearch 服务的配置,启动 elasticsearch 服务 -
docker-compose.yaml
version: '3' services: es: container_name: es image: docker.elastic.co/elasticsearch/elasticsearch:7.14.0 restart: always environment: - node.name=es01 - discovery.type=single-node - bootstrap.memory_lock=true # 必须在 elasticsearch 中启用CORS,否则您的浏览器将因违反同源策略而拒绝 elasticsearch-head 的请求 - http.cors.enabled=true - http.cors.allow-origin="*" ulimits: memlock: soft: -1 hard: -1 volumes: - data01:/usr/share/elasticsearch/data ports: - 9200:9200 volumes: data01: driver: local
# 启动 elasticsearch 服务 docker-compose up -d es # 验证启动成功,访问接口正常返回 curl http://0.0.0.0:9200
在每个被收集端配置并启动 filebeat 服务 -
filebeat.yml
-docker-compose.yaml
# https://www.elastic.co/guide/en/beats/filebeat/current/configuration-autodiscover.html filebeat.config: modules: path: ${path.config}/modules.d/*.yml reload.enabled: false filebeat.autodiscover: providers: - type: docker templates: - condition: contains: docker.container.image: nginx config: - type: container paths: - /var/lib/docker/containers/${data.docker.container.id}/*.log # 一个可选的配置设置,指定要应用行过滤和多行设置的 JSON 键。如果指定,键必须在 JSON 对象的顶层,与键关联的值必须是字符串,否则不会发生过滤或多行聚合(直接抽取一行日志中字段名字为"log"的key,变为顶级字段) json.message_key: log # 默认情况下,解码后的 JSON 放在输出文档中的“json”键下。如果启用此设置,则密钥将复制到输出文档的顶层。默认值为false --配合json.message_key使用 json.keys_under_root: true # 如果启用此设置,Filebeat 会添加“error.message”和“error.type: json”键,以防出现 JSON 解组错误或message_key在配置中定义了a但无法使用 json.add_error_key: true processors: - add_cloud_metadata: ~ output.elasticsearch: hosts: '${ELASTICSEARCH_HOSTS:elasticsearch:9200}' username: '${ELASTICSEARCH_USERNAME:}' password: '${ELASTICSEARCH_PASSWORD:}'
version: '3' services: filebeat: container_name: filebeat image: docker.elastic.co/beats/filebeat:7.14.0 restart: always user: root environment: - ELASTICSEARCH_HOSTS=172.22.241.70:9200 volumes: - ./volume/filebeat/config/filebeat.docker.yml:/usr/share/filebeat/filebeat.yml:ro - /home/docker-data/containers:/var/lib/docker/containers:ro - /var/run/docker.sock:/var/run/docker.sock:ro
展示在Grafana, ID:
14913
- 打开 Grafana 页面,登录后,在
Data Sources
添加类型为Elasticsearch
的数据源 - 在
HTTP
段,把上面启动 es 机器的IP地址和端口填写到URL
输入框中,比如:http://es:9200
- 在
Elasticsearch details
段- 把上面 filebeat 配置的nginx索引名称填写到
Index name
输入框中,比如:filebeat-7.14.0*
Version
选择7.0+
- 保存测试
- 把上面 filebeat 配置的nginx索引名称填写到
- 导入Dashboard,ID:
14913
- 打开 Grafana 页面,登录后,在