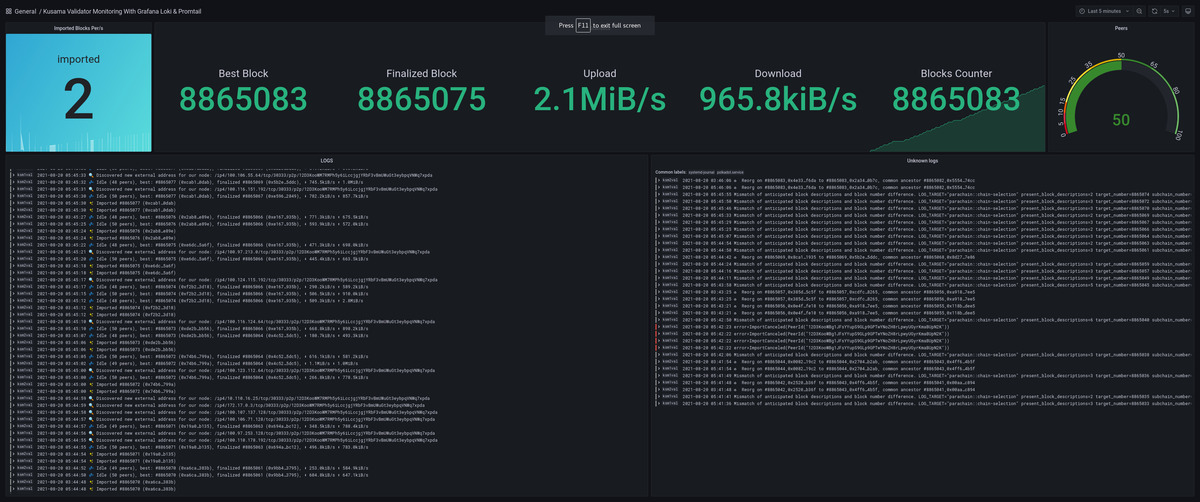
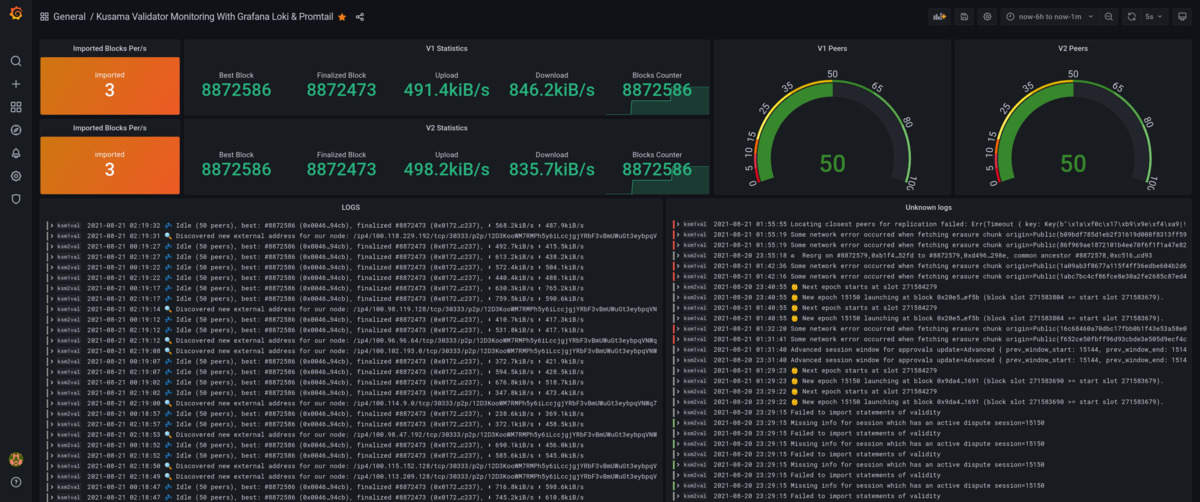
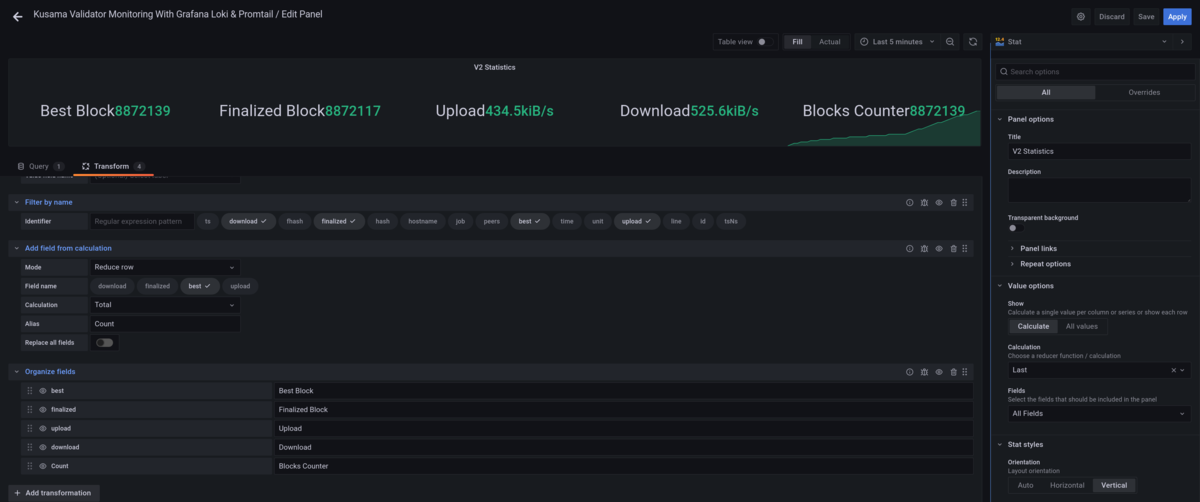
Kusama Validator Monitoring With Grafana Loki & Promtail
A basic monitoring based on the Pokkadot log level='info' for the Mobile Version: https://grafana.com/grafana/dashboards/14901
based on the level="info" logs by the application. Full installation instructions: https://github.com/TGReaper/kusama-promtail
For Support && Nominations in KUSAMA NETWORK: Validators Display name. KSMNETWORK
KUSAMA (KSM) Address H1bSKJxoxzxYRCdGQutVqFGeW7xU3AcN6vyEdZBU7Qb1rsZ
OR
PolkaDOT (DOT) Address: 15FxvBFDd3X7H9qcMGqsiuvFYEg4D3mBoTA2LQufreysTHKA
Data source config
Collector config:
Upload an updated version of an exported dashboard.json file from Grafana
| Revision | Description | Created | |
|---|---|---|---|
| Download |
Grafana Loki (self-hosted)
Easily monitor Grafana Loki (self-hosted), a horizontally scalable, highly available, multi-tenant log aggregation system inspired by Prometheus, with Grafana Cloud's out-of-the-box monitoring solution.
Learn more


