Purple Air PAII Air Quality
Grafana Dashboard for use with the purple_exporter Prometheus exporter.
purple_exporter Dashboard
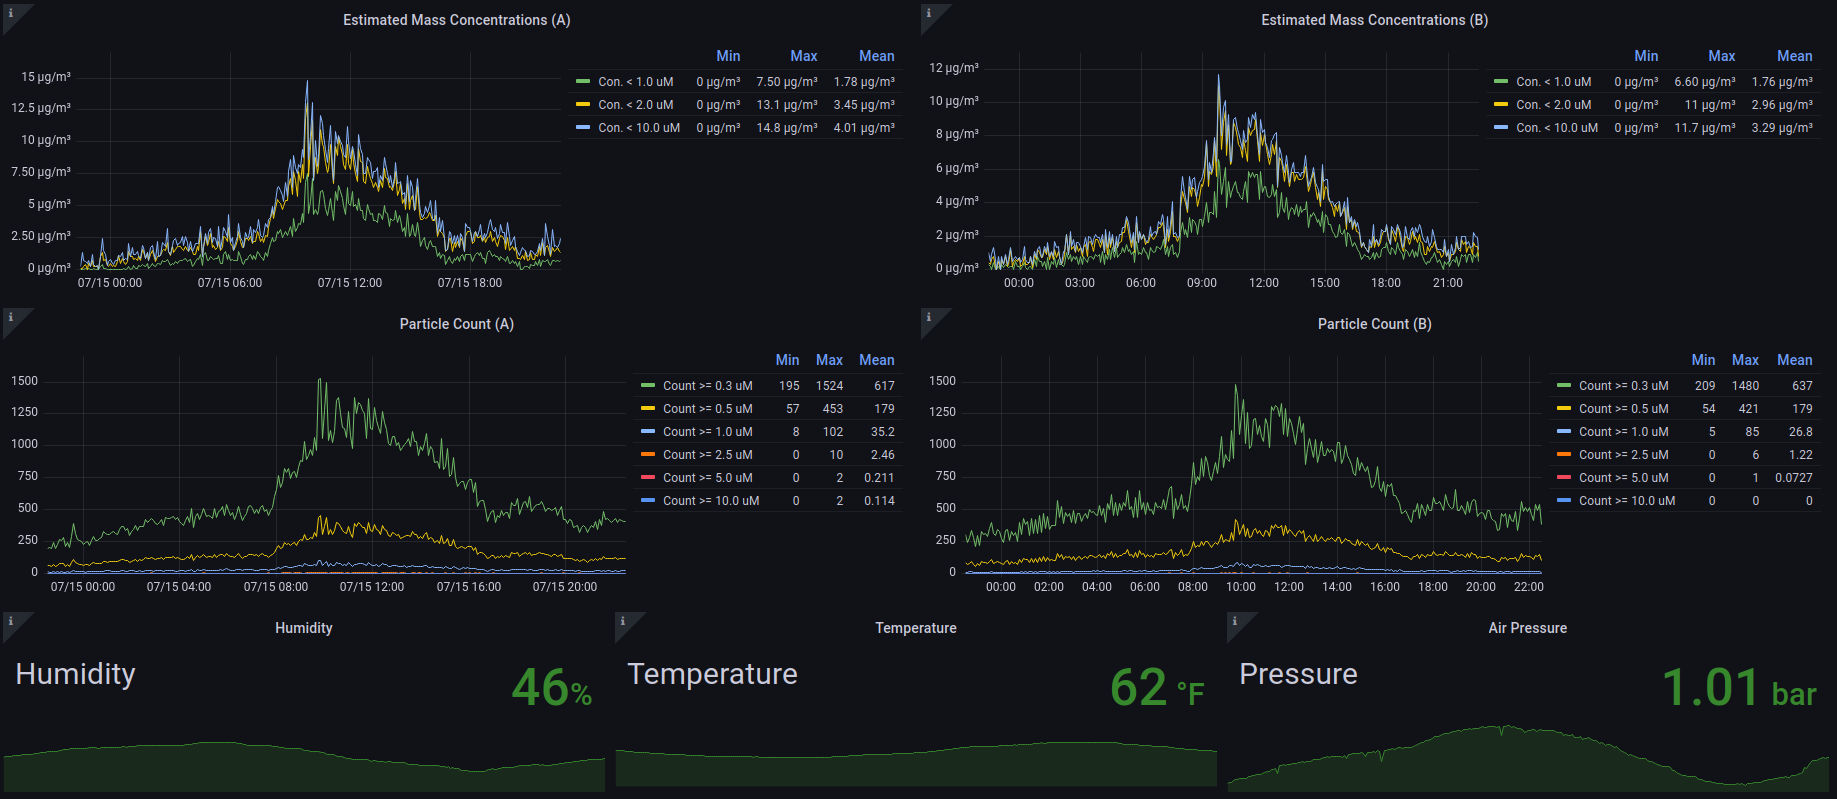
This Dashboard is an example for use alongside purple_exporter. Instructions for setting up the associated Prometheus exporter can be found with the purple_exporter Github repo.
This dashboard displays the following information, as collected from a PAII Purple Air Sensor connected to an instance of purple_exporter.
- Air Temperature
- Air Pressure
- Ambient Humidity
- Particle Estimated Mass Concentration for Sensors A and B of particles less than:
- 1.0 uM in diameter
- 2.0 uM in diameter
- 10.0 uM in diameter
- Particle Counts for Sensors A and B of particles greater than:
- 0.3 uM in diameter
- 0.5 uM in diameter
- 1.0 uM in diameter
- 2.5 uM in diameter
- 5.0 uM in diameter
- 10.0 uM in diameter
As Purple Air asks that API requests be limited to once every 5 minutes, the default, and fastest refresh rate for this dashboard is 5 minutes.
Data source config
Collector config:
Upload an updated version of an exported dashboard.json file from Grafana
| Revision | Description | Created | |
|---|---|---|---|
| Download |

