
HCL Workload Automation Grafana Dashboard for Kubernetes environments 9.5 FP4
Visualize Workload Automation and related Kubernetes metrics
HCL Workload Automation Performance Dashboard
Overview
HCL Workload Automation uses Grafana to display performance data related to the product. This data includes metrics related to the server and console application servers (WebSphere Application Server Liberty Base), your workload, your workstations, critical jobs, message queues, the database connection status, and more. Metrics provide insight into the state, health, and performance of your deployments and infrastructure. HCL Workload Automation cloud metric monitoring uses an opensource Cloud Native Computing Foundation (CNCF) project called Prometheus. It is particularly useful for collecting time series data that can be easily queried.
Metrics
| Metric | Description |
|---|---|
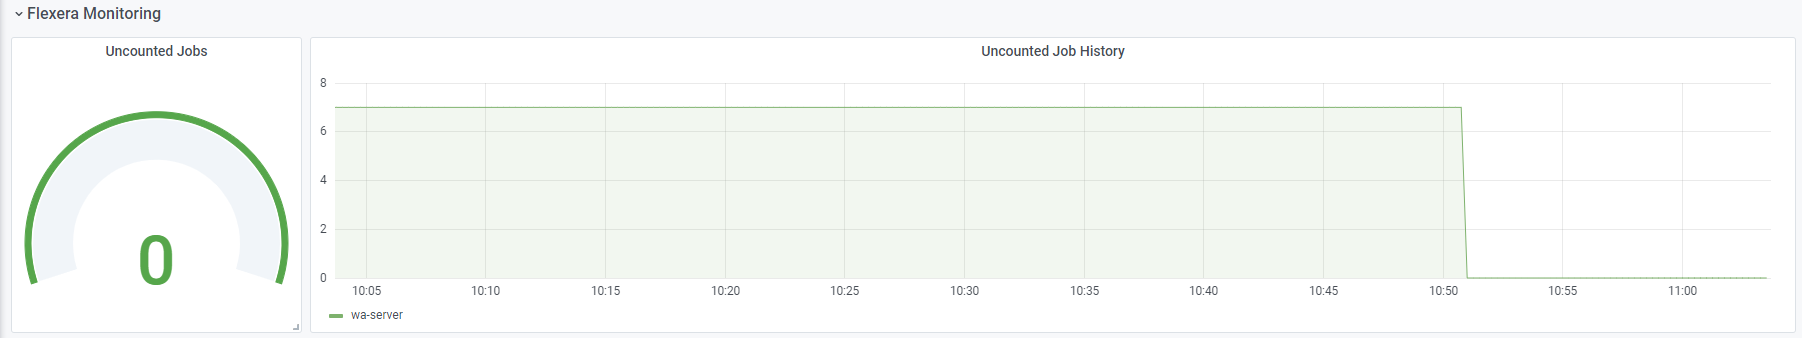
| Flexera Monitoring | The number of jobs that ran and Flexera was unable to count |
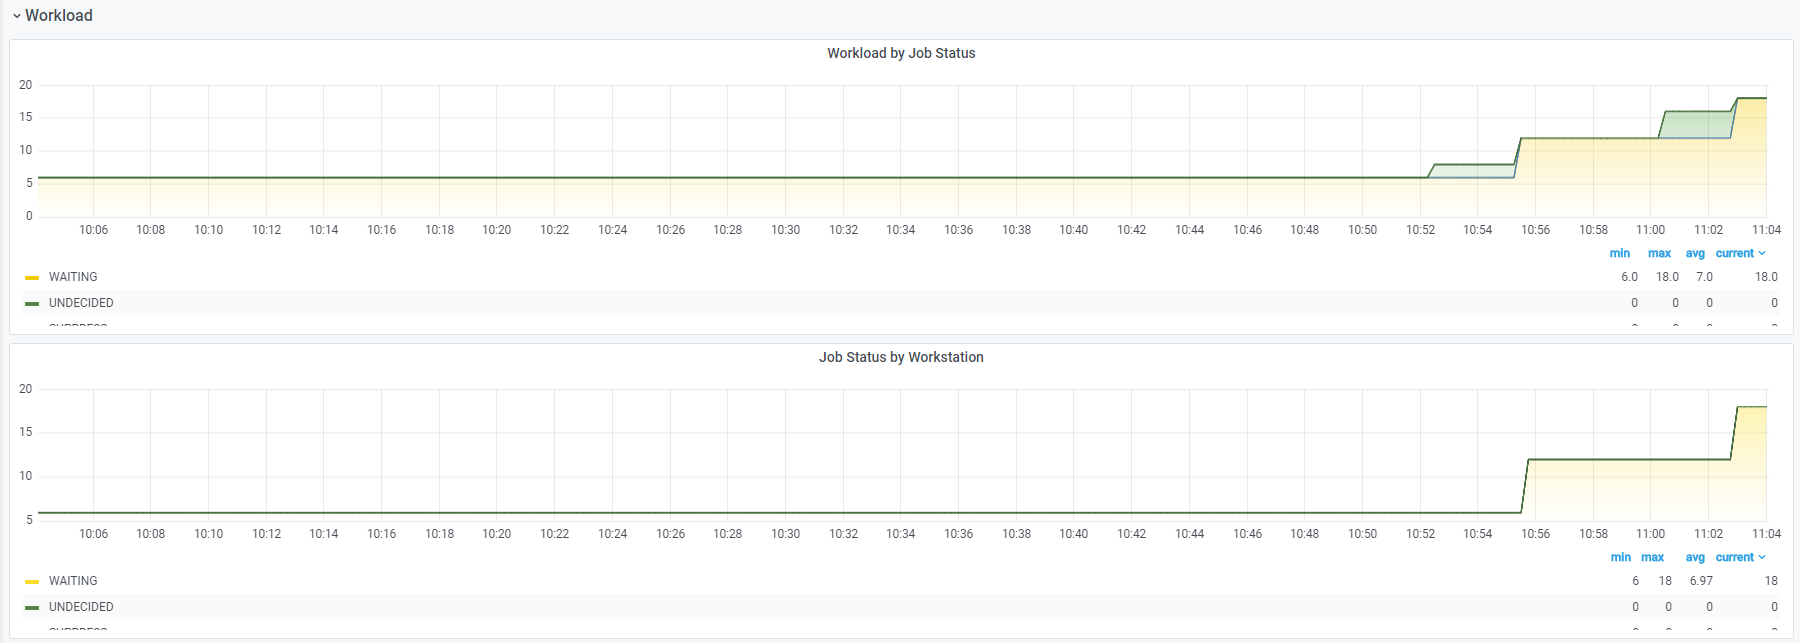
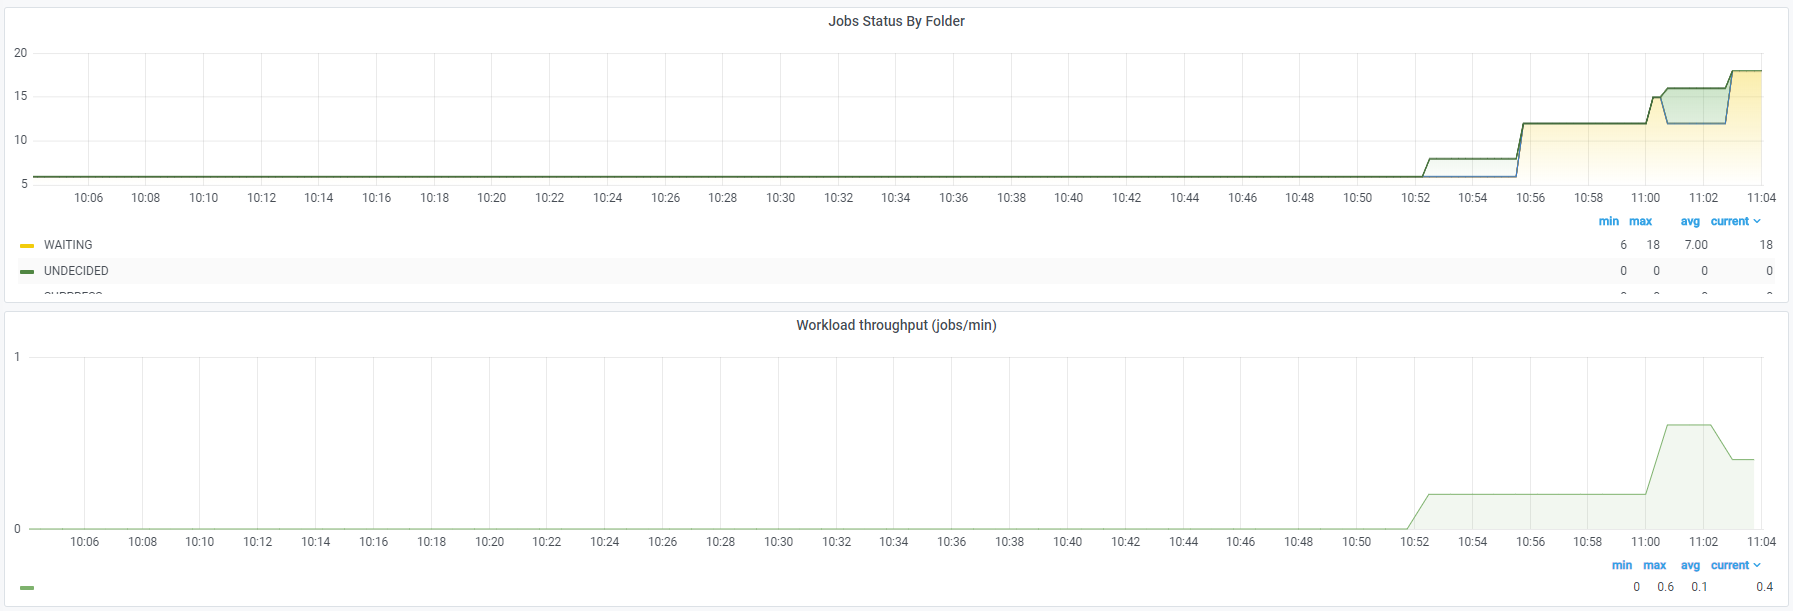
| Workload | Jobs by status, Jobs by workstation, Jobs by folder and the Workload throughput by jobs/minutes |
| Critical Jobs | Incomplete predecessors, critical jobs, risk level for potential and high risks, estimated end and confidential factor |
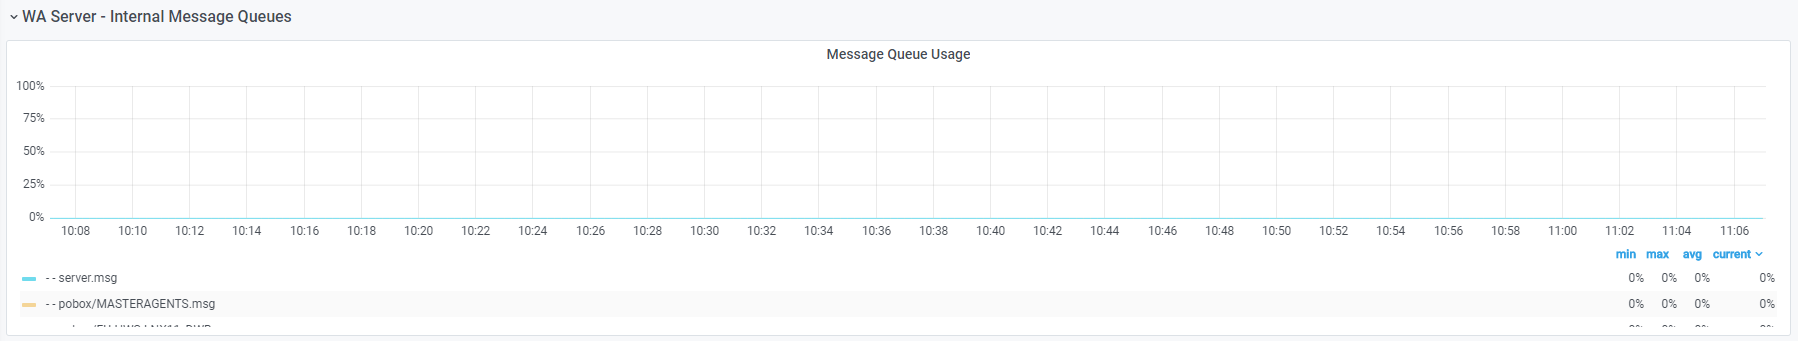
| WA Server Internal Message Queue | Internal message queue usage for Appserverbox.msg, Courier.msg, mirrorbox.msg, Mailbox.msg, Monbox.msgn, Moncmd.msg, auditbox.msg, clbox.msg, planbox.msg, Intercom.msg, pobox messages, and server.msg |
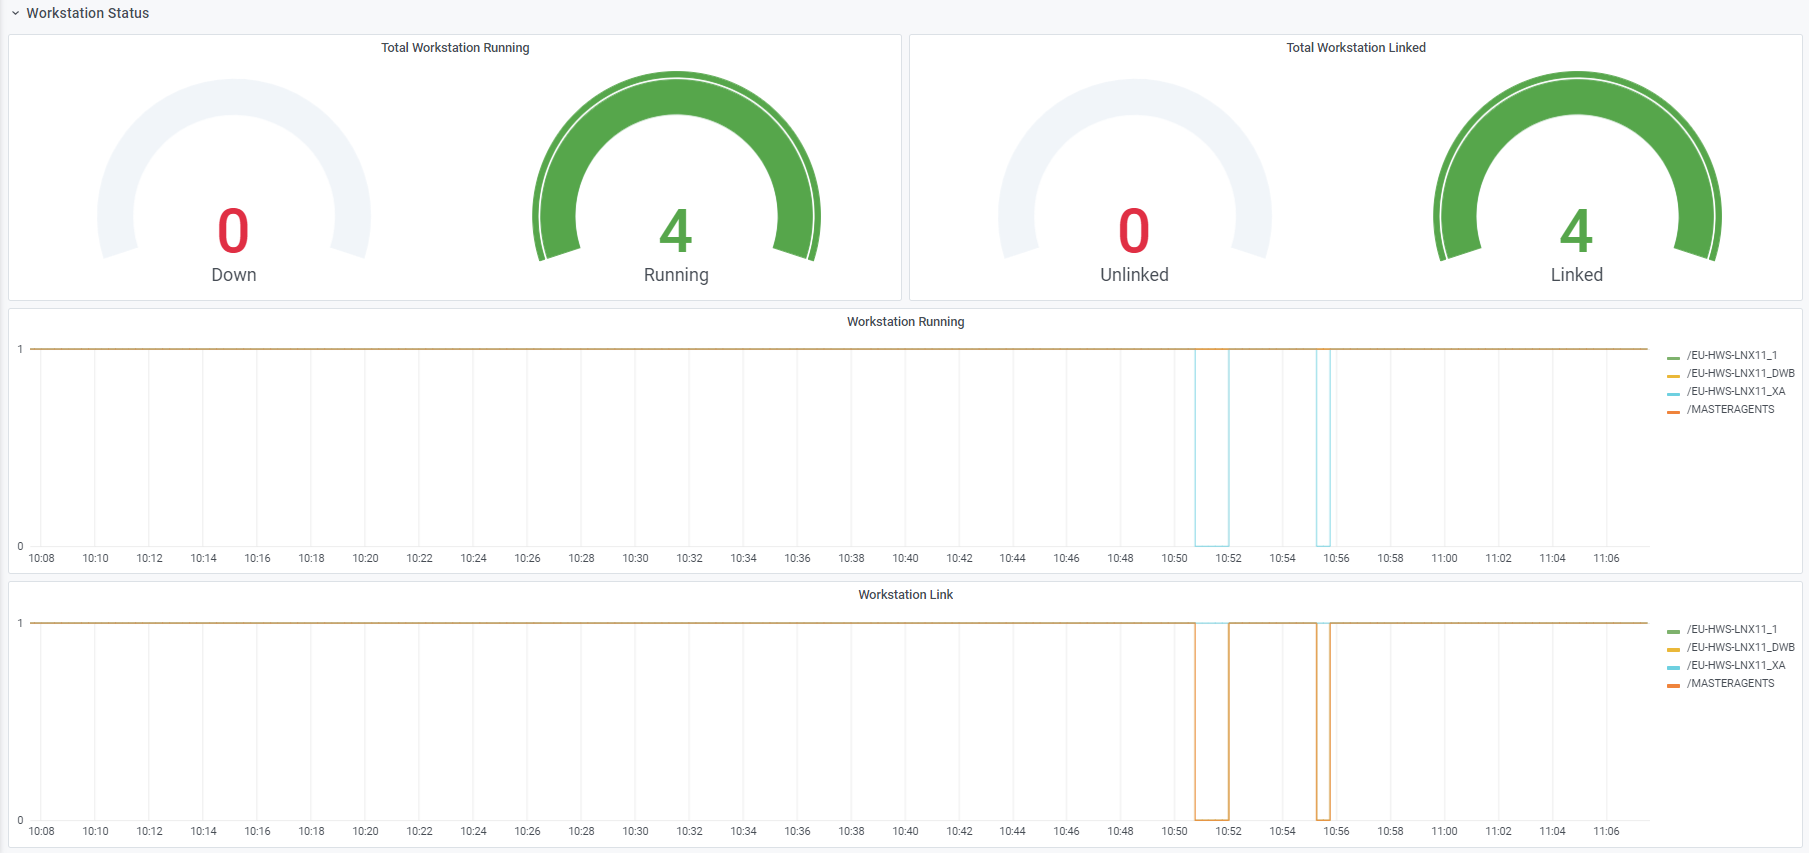
| Workstation Status | The number of running workstations and linked workstations |
| Database Connection Status | The connection to the database status |
| PODs | POD restarts, Failing PODs, POD CPU usage, Network I/O and RAM usage |
| Persistent Volumes | Volumes capacity and Space used |
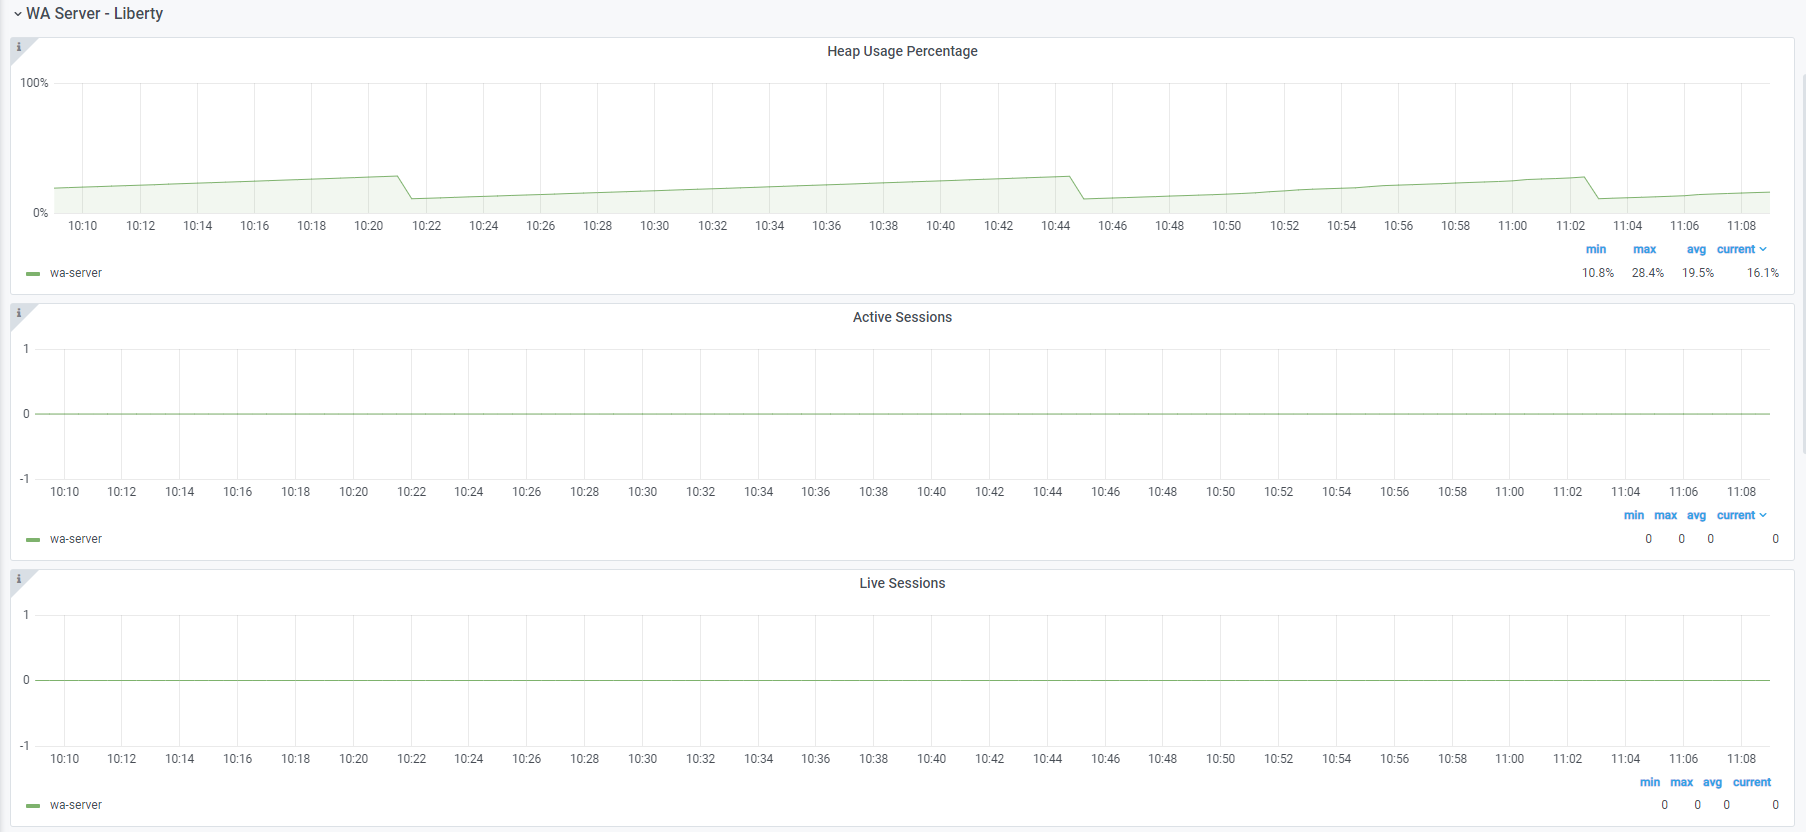
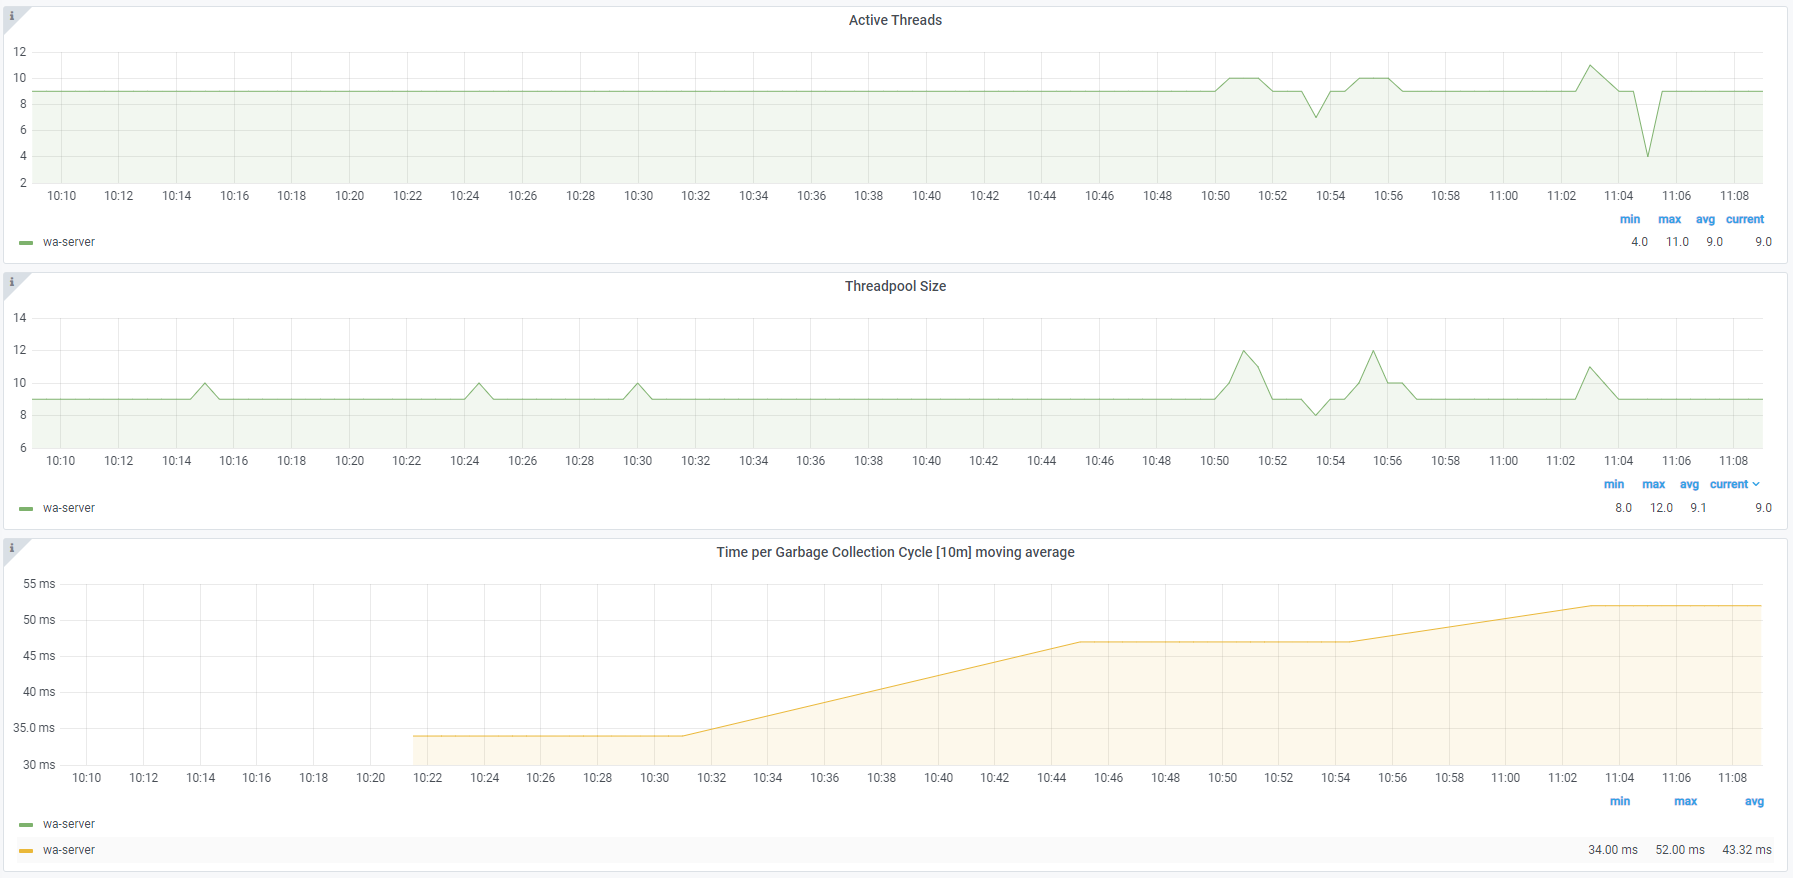
| WA Server and Console - Liberty | Heap usage percentage, Active sessions, Live sessions, Active threads, Threadpool size and Time per garbage collection cycle moving average |
| WA Sever and Console - Connection Pools (Liberty) | Average time usage per connection over last, Managed connections, Free connection, Connection handles and Created and Destroyed connections |
For more information see our Documentation
Flexera Monitoring

Workload


Internal Message Queues

Workstation Status

Liberty


Note: Version 9.5, Fix Pack 4 is required to enable the following monitoring features:
- Critical Jobs metric
- Workstation status metric
- Database connection status metric
- Job, Job stream, and Workstation Filters
Earlier versions of the product enable only a subset of the monitoring features available with Version 9.5, Fix Pack 4.
This Dashboard is licensed under Apache 2.0 license.
Data source config
Collector config:
Upload an updated version of an exported dashboard.json file from Grafana
| Revision | Description | Created | |
|---|---|---|---|
| Download |
Kubernetes
Monitor your Kubernetes deployment with prebuilt visualizations that allow you to drill down from a high-level cluster overview to pod-specific details in minutes.
Learn more