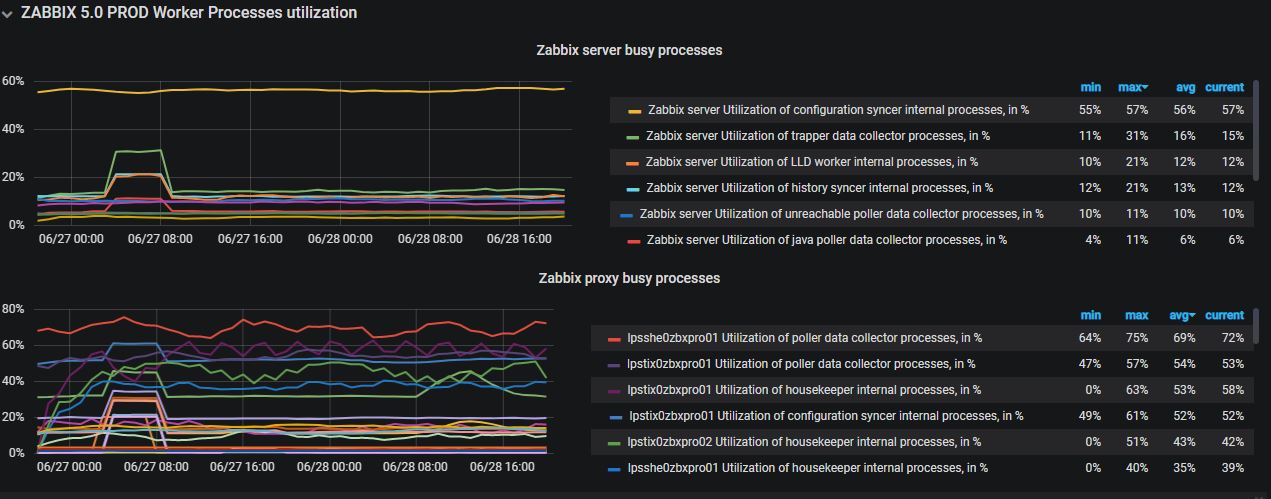
Zabbix Monitor System Running Status
this dashboards from ES and zabbix app datasource, can to select any time range datas of Overall operation index.
step one: active data export function in the zabbix server. step two: filebeat and logstash to use ETL and forward es index. step three: grafana add es datasource of zabbix system. step four: via dsl select Monitoring indicators and event history from ES index.
Data source config
Collector config:
Upload an updated version of an exported dashboard.json file from Grafana
| Revision | Description | Created | |
|---|---|---|---|
| Download |

