WeatherFlow Collector - System Stats
WeatherFlow Collector provides multiple ways of collecting data from the WeatherFlow Tempest, Air, and Sky weather systems. These Grafana dashboards offer visualizations in real-time for current conditions, derived metrics, and forecasting.
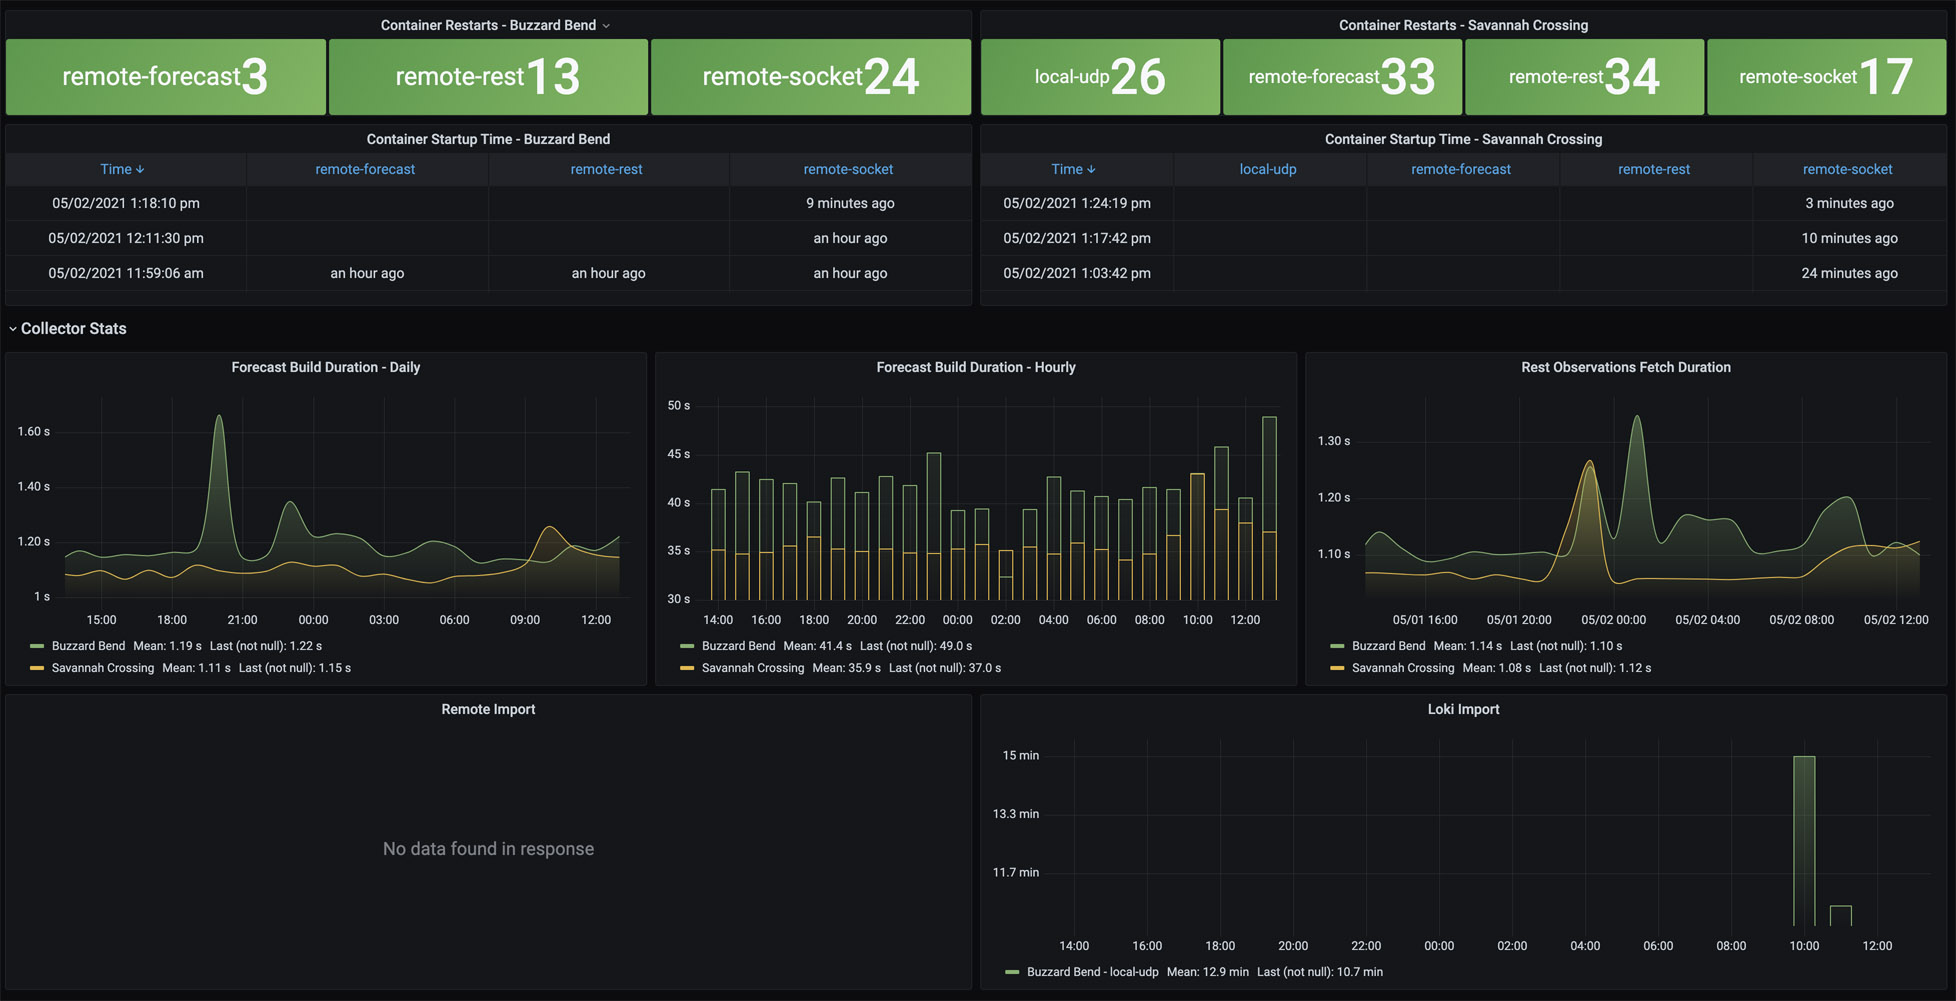
Provides for two different system metrics to understand the health of your weatherflow-collector. At the top shows which container is running and each of the times that it last started. A default Docker health check is enabled for each container that requires some data to be received and persisted every 60 seconds, or the container is marked unhealthy. This check happens every 5 seconds and will restart the container after three failed checks.
The second section shows how long it's taking to receive and persist forecasts and observations.
- Forecast Build Duration - Daily - between 1 and 2 seconds
- Forecast Build Duration - Hourly - between 30 and 45 seconds (note - if this takes longer than 60 seconds, the Docker Health Check will currently recycle the container.
- Rest Observations - between 1 and 2 seconds
More details on these WeatherFlow Collector dashboards may be found:
- Github Project: https://github.com/lux4rd0/weatherflow-collector/
- Web Site: https://labs.lux4rd0.com/weatherflow-collector/
Data source config
Collector config:
Upload an updated version of an exported dashboard.json file from Grafana
| Revision | Description | Created | |
|---|---|---|---|
| Download |