
GCP Stackdriver
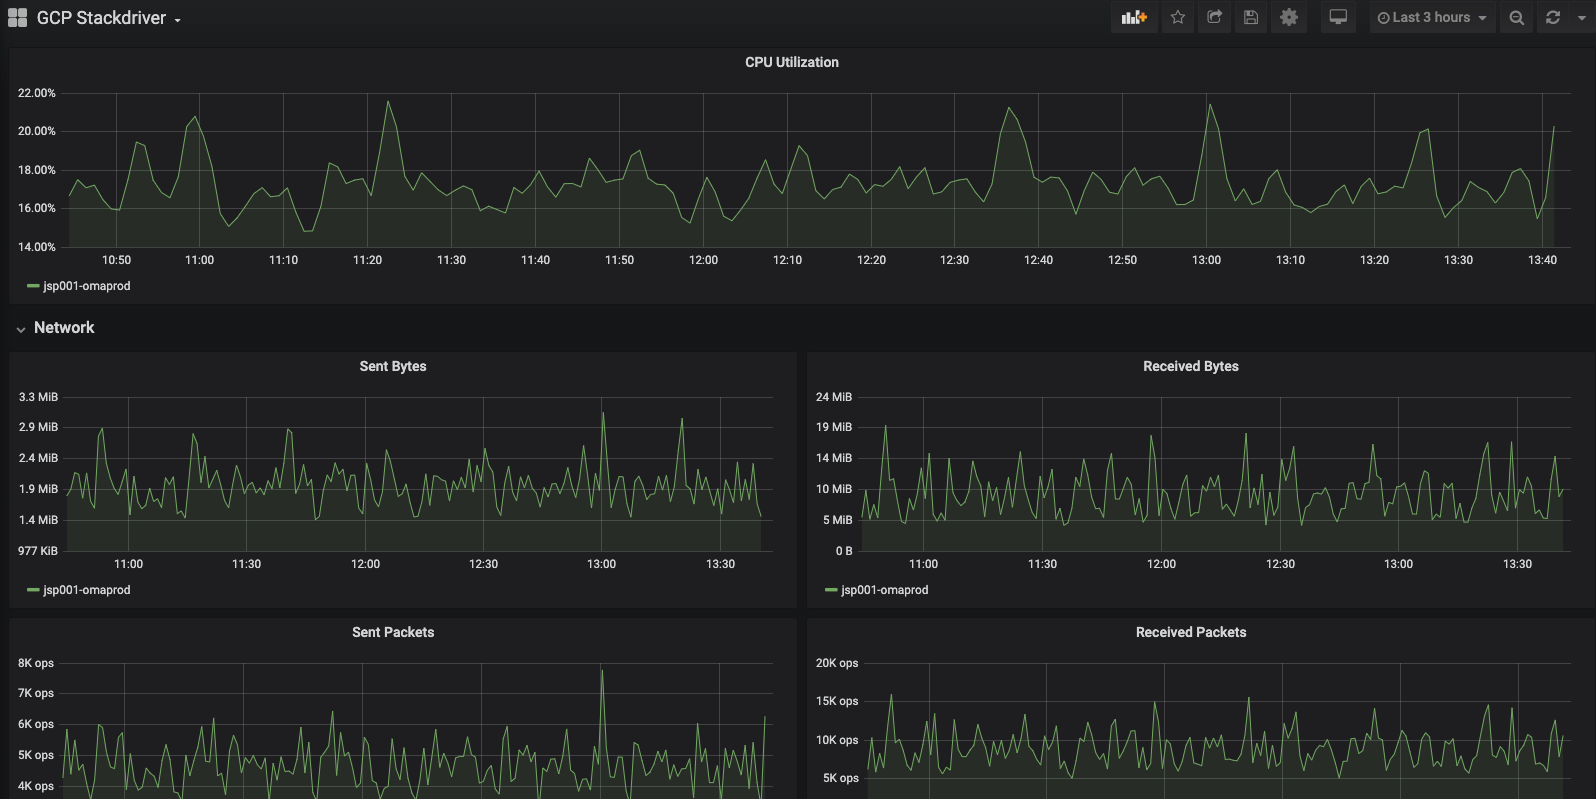
VM metrics from GCP Stackdriver
Connect your GCP service account with grafana https://grafana.com/docs/grafana/latest/datasources/google-cloud-monitoring/
Select your project and view all of the Stackdriver metrics from the hypervisor.
Includes throttled disk operations and dropped packets
Data source config
Collector type:
Collector plugins:
Collector config:
Revisions
Upload an updated version of an exported dashboard.json file from Grafana
| Revision | Description | Created | |
|---|---|---|---|
| Download |