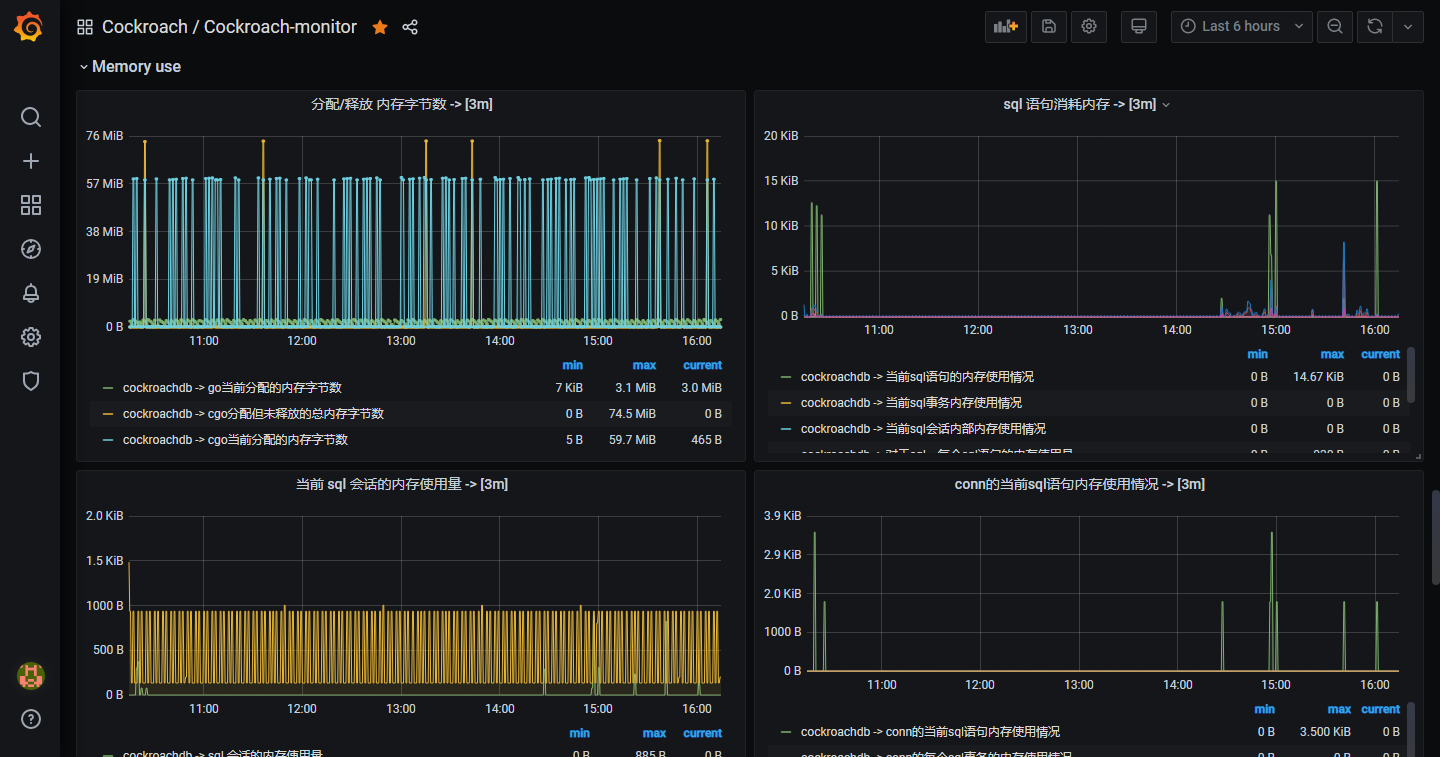
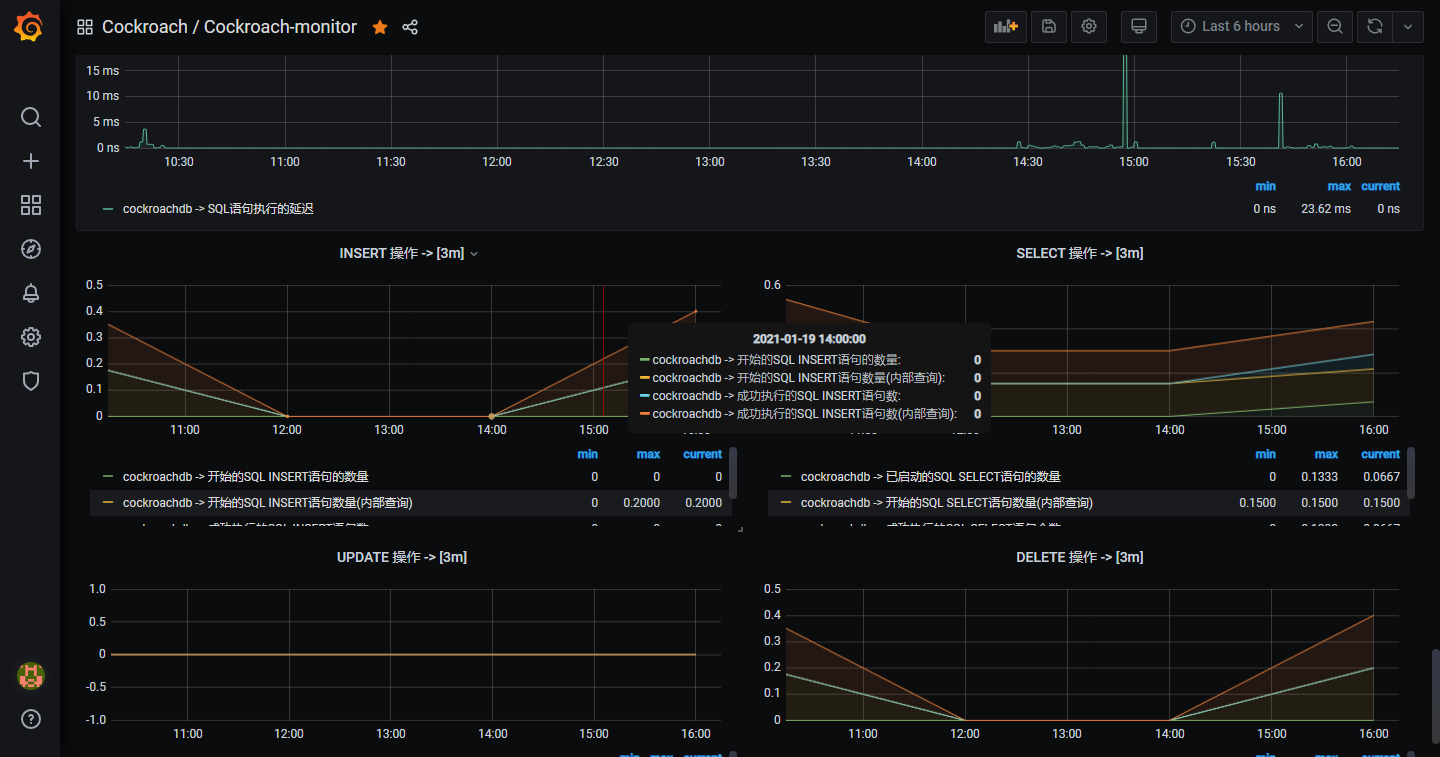
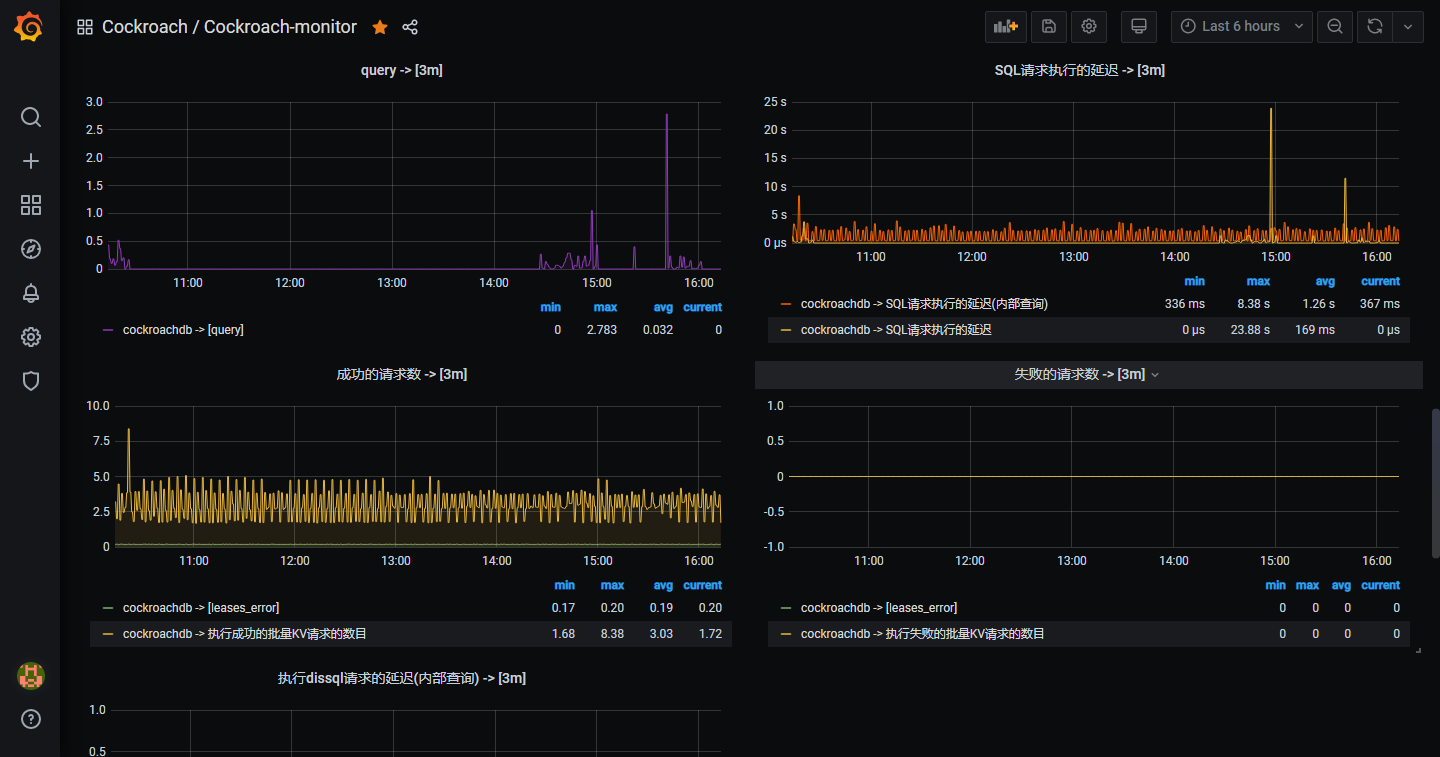
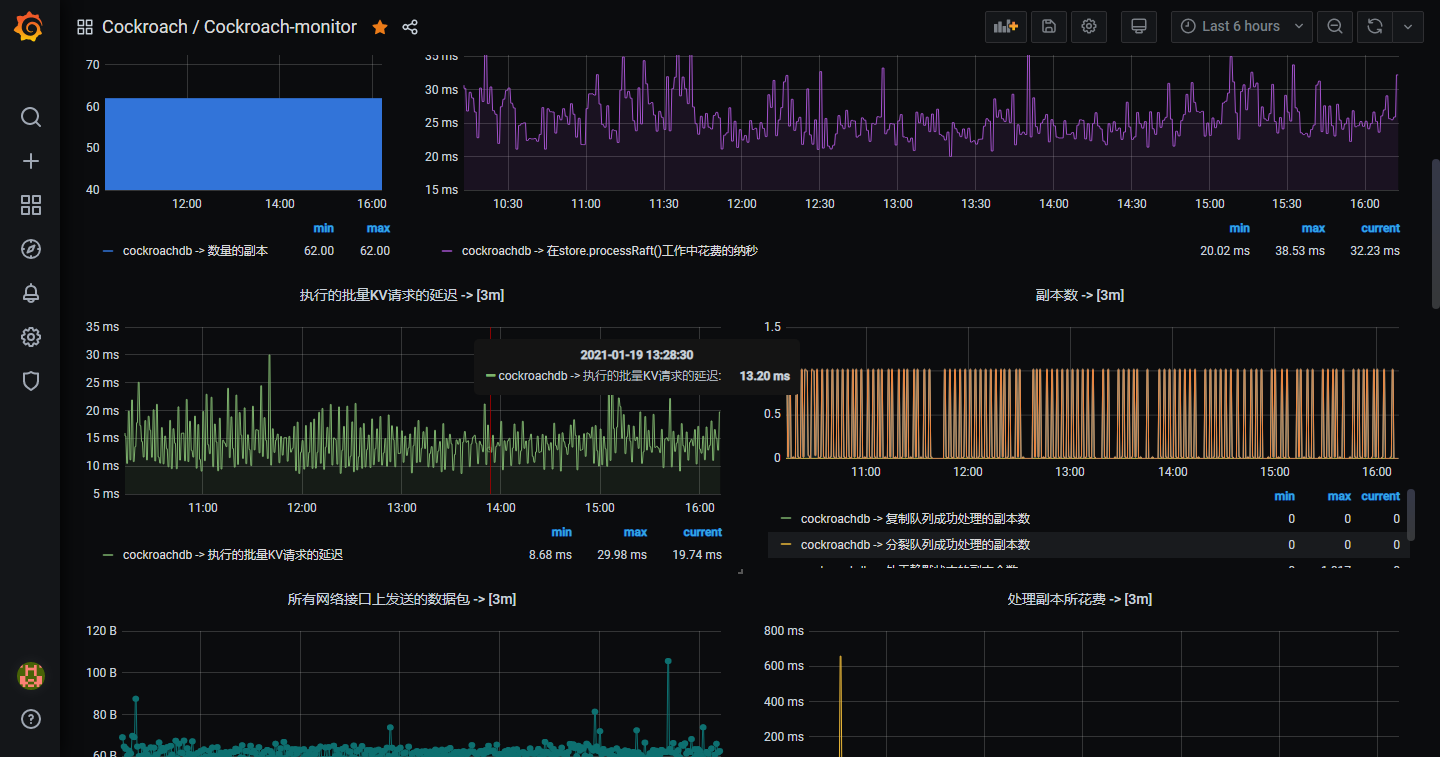
Cockroach-monitor
cockroachdb monitor
Collect metric configuration:
Display indicator command:
- curl -vk "http://:8080/_status/vars"
Data source config
Collector config:
Upload an updated version of an exported dashboard.json file from Grafana
| Revision | Description | Created | |
|---|---|---|---|
| Download |


