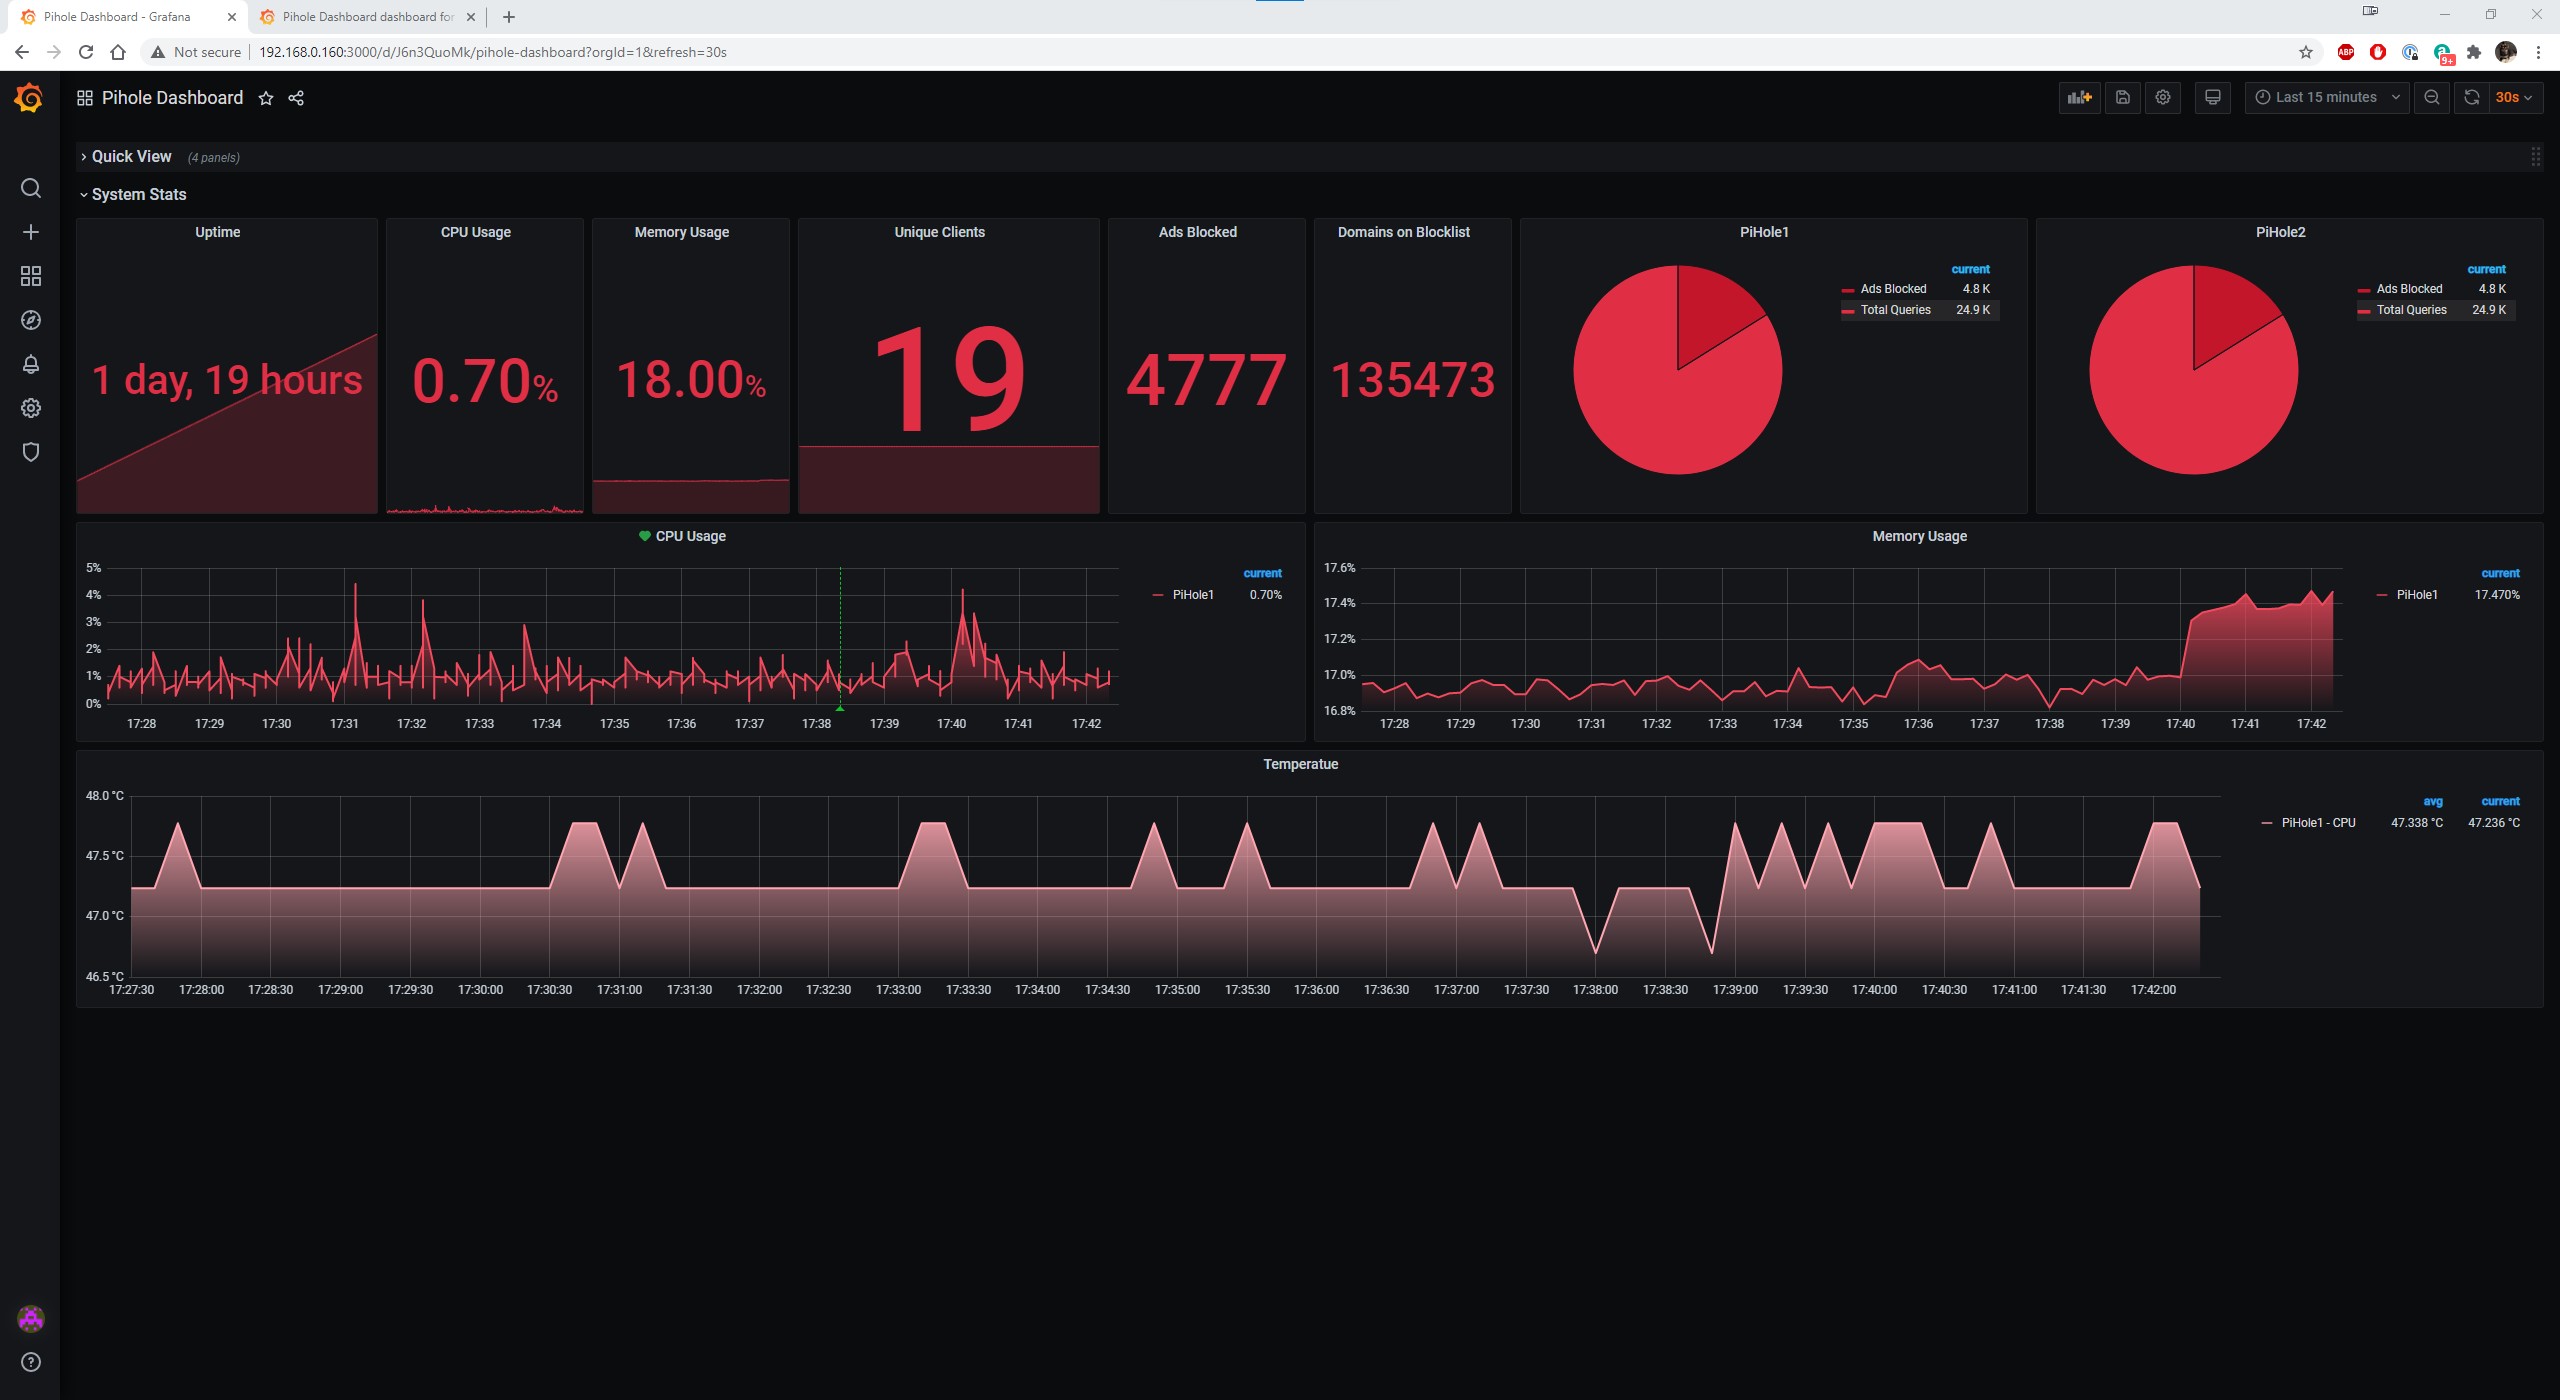
Pi hole Dashboard
Basic Pihole dashboard stuff that I am messing around with
Just tossing some pi hole metrics on a dashboard to share with some people.
Telegraf.conf plugin info:
I did not write the pihole specific config, I borrowed from someone else
I also used [[inputs.sensors]], [[inputs.mem]], [[inputs.system]] , [[inputs.cpu]].
outputs: [[outputs.influxdb]] urls= ["http://youripgoeshere:port"] database = pihole1
These are basic telegraf inputs/output see telegraf documentation for them.
Data source config
Collector config:
Upload an updated version of an exported dashboard.json file from Grafana
| Revision | Description | Created | |
|---|---|---|---|
| Download |
Raspberry Pi
Easily monitor Raspberry Pi, the small, single-board computers, with Grafana Cloud's out-of-the-box monitoring solution.
Learn more
