JMeter Load Test (org.md.jmeter.influxdb.visualizer)_
Provides the possibility to see live JMeter metrics (aggregation table, errors, the response body of failures), uses the same mechanics to generate the report with metrics as JMeter.
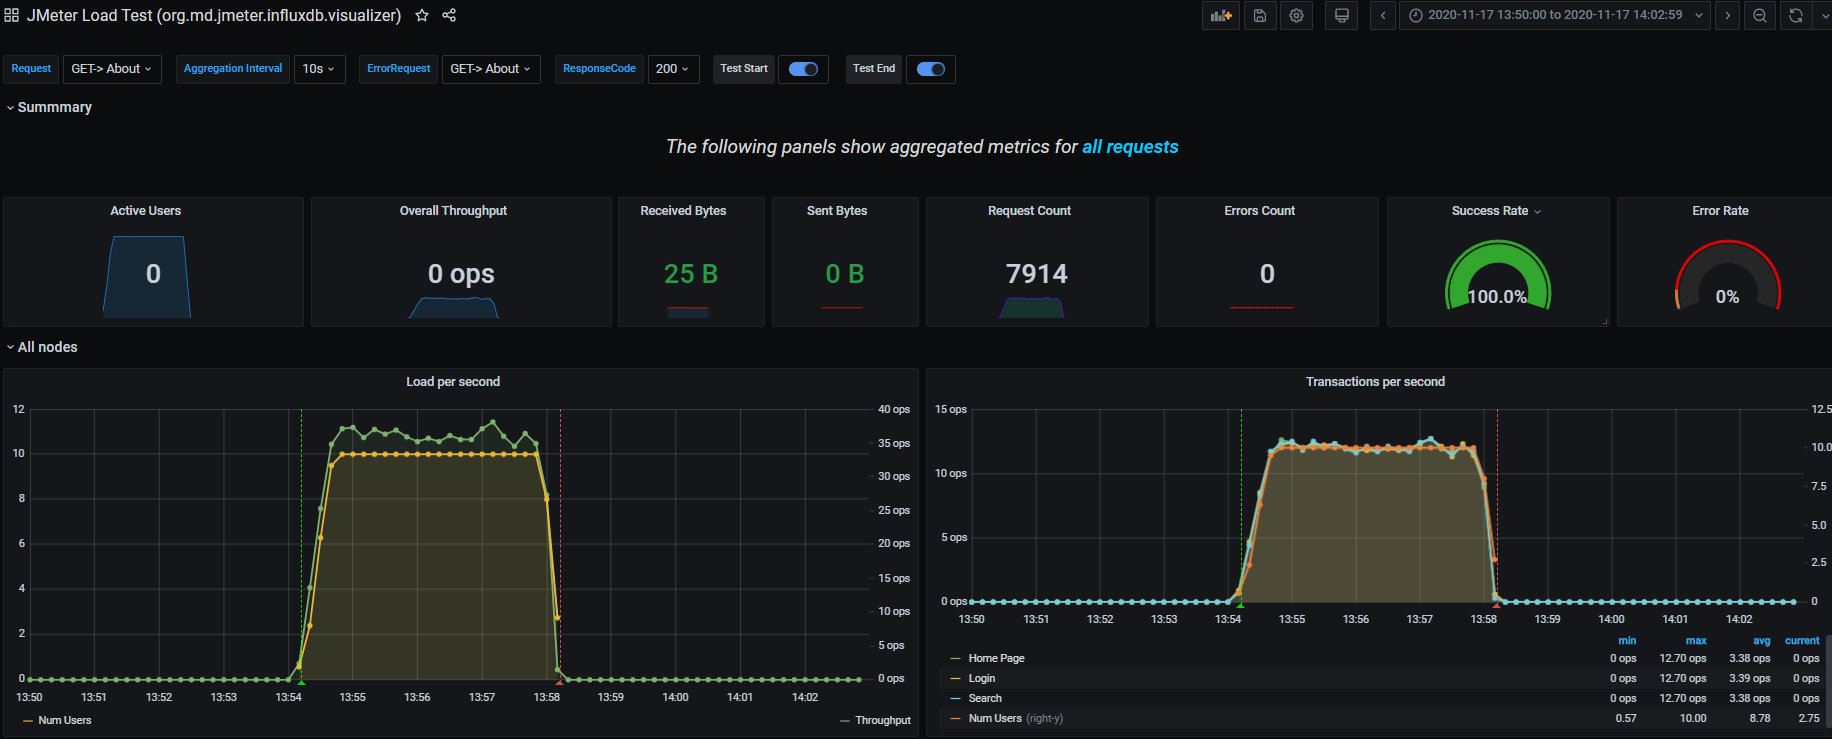
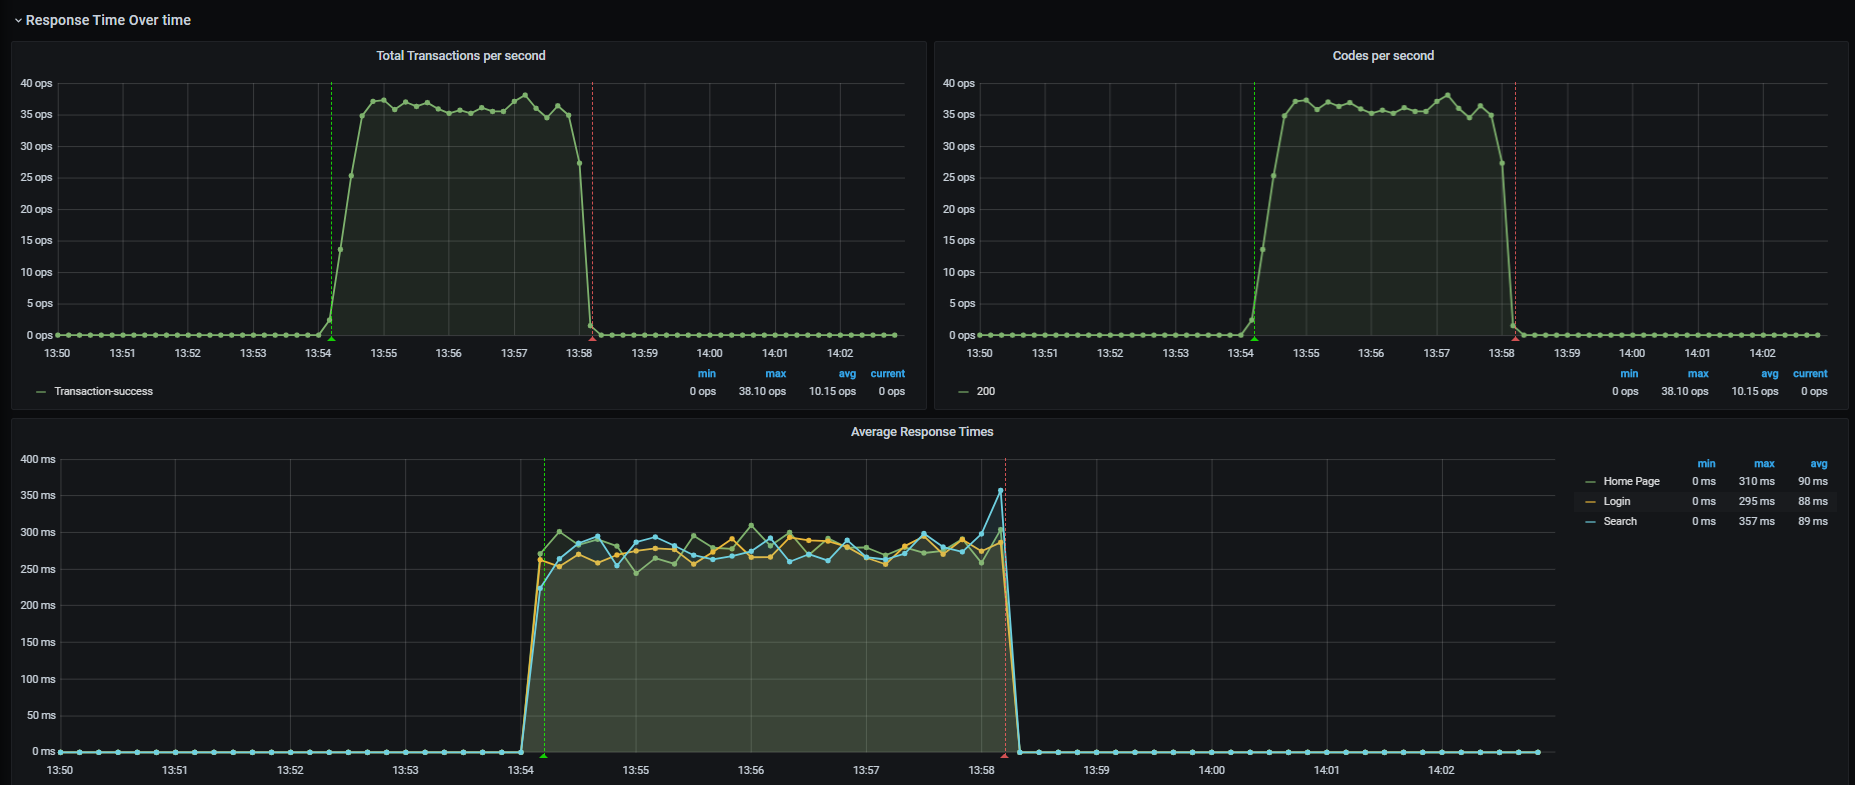
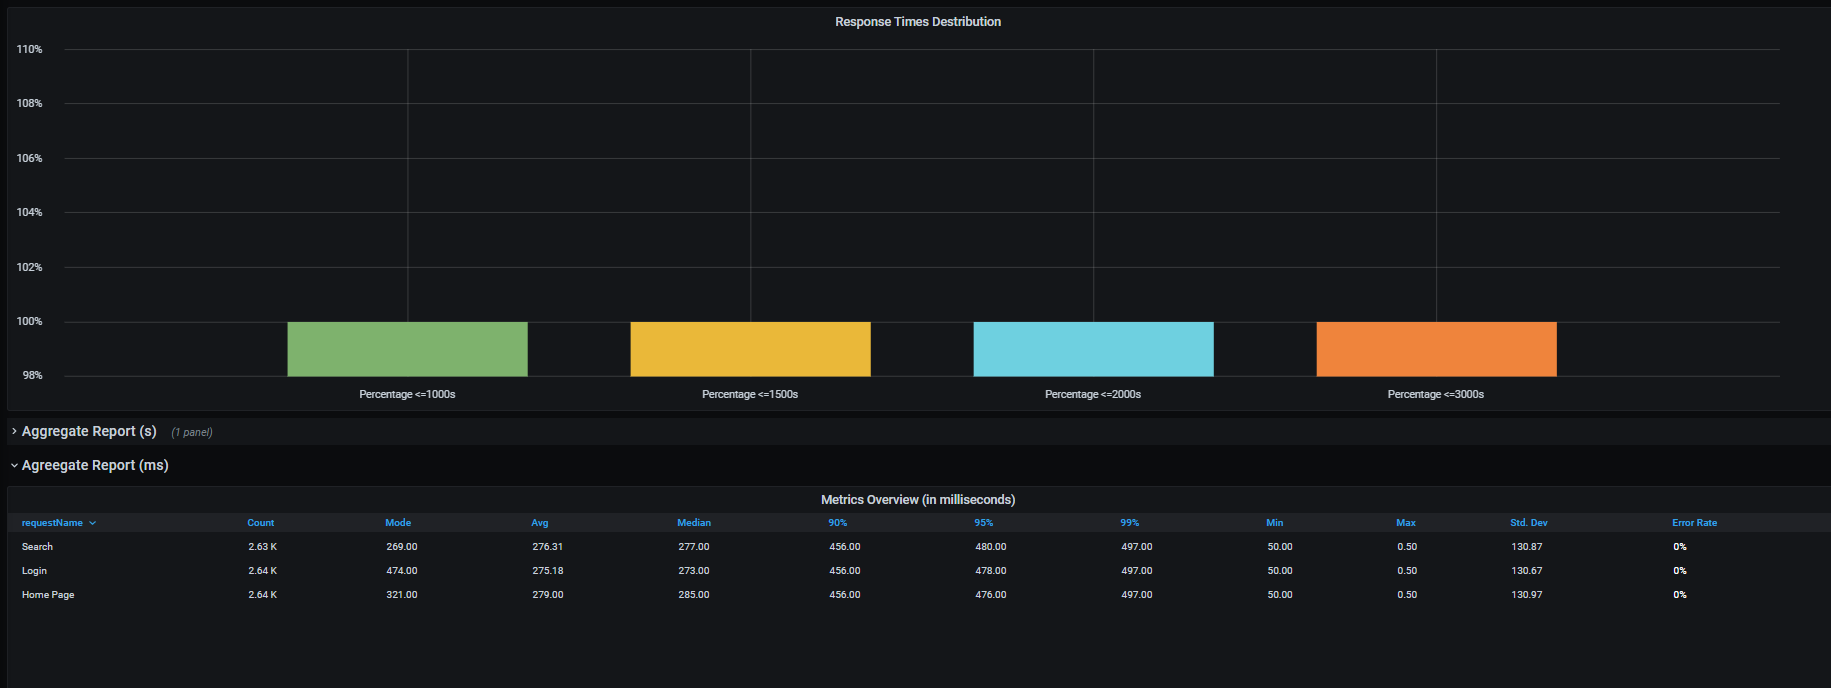
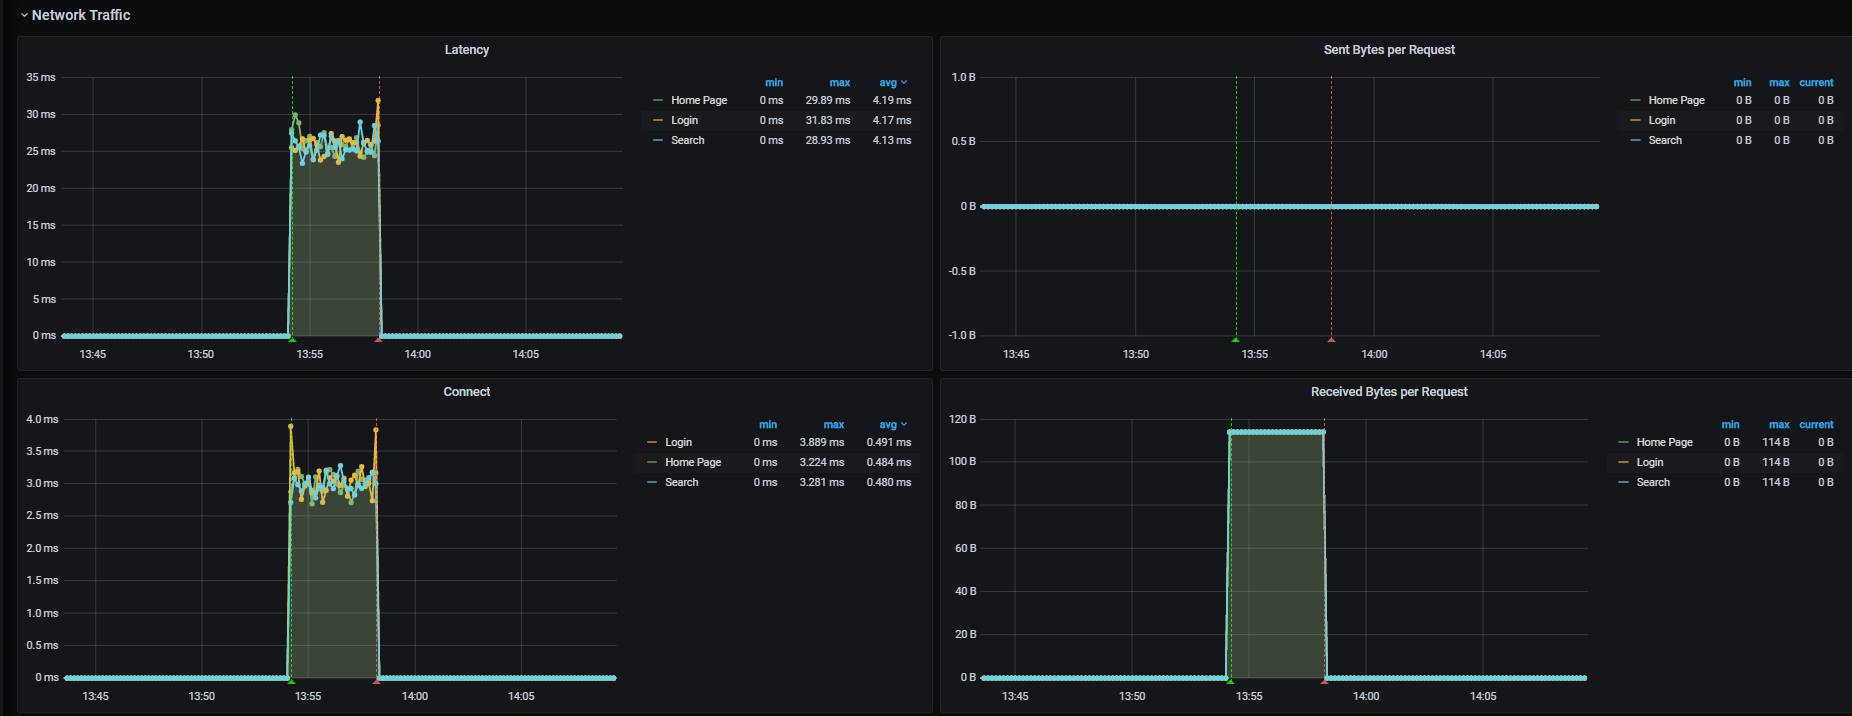
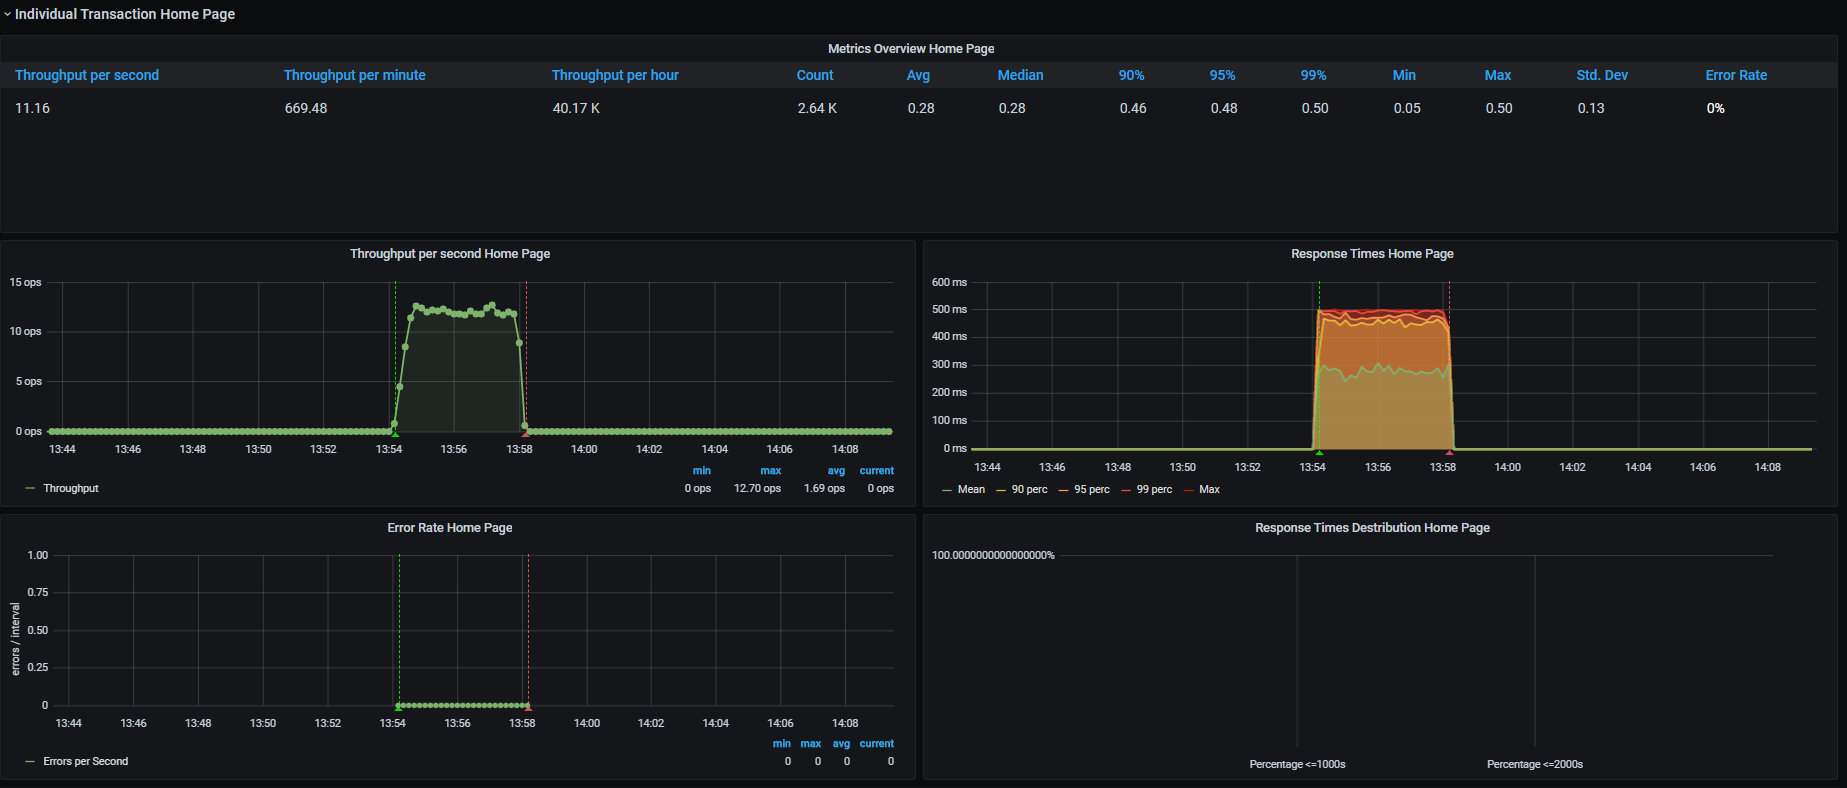
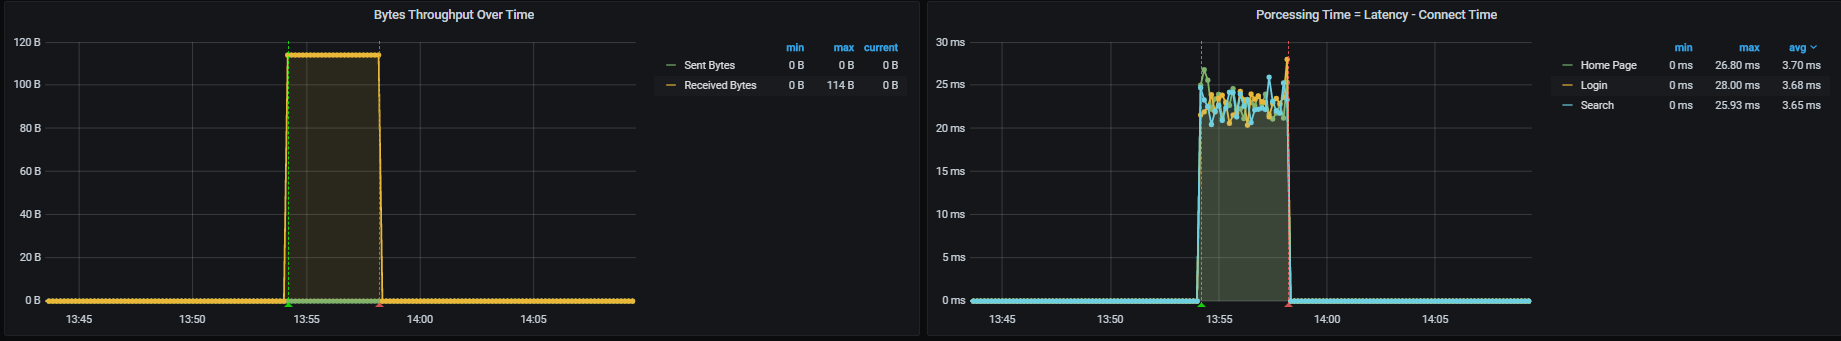
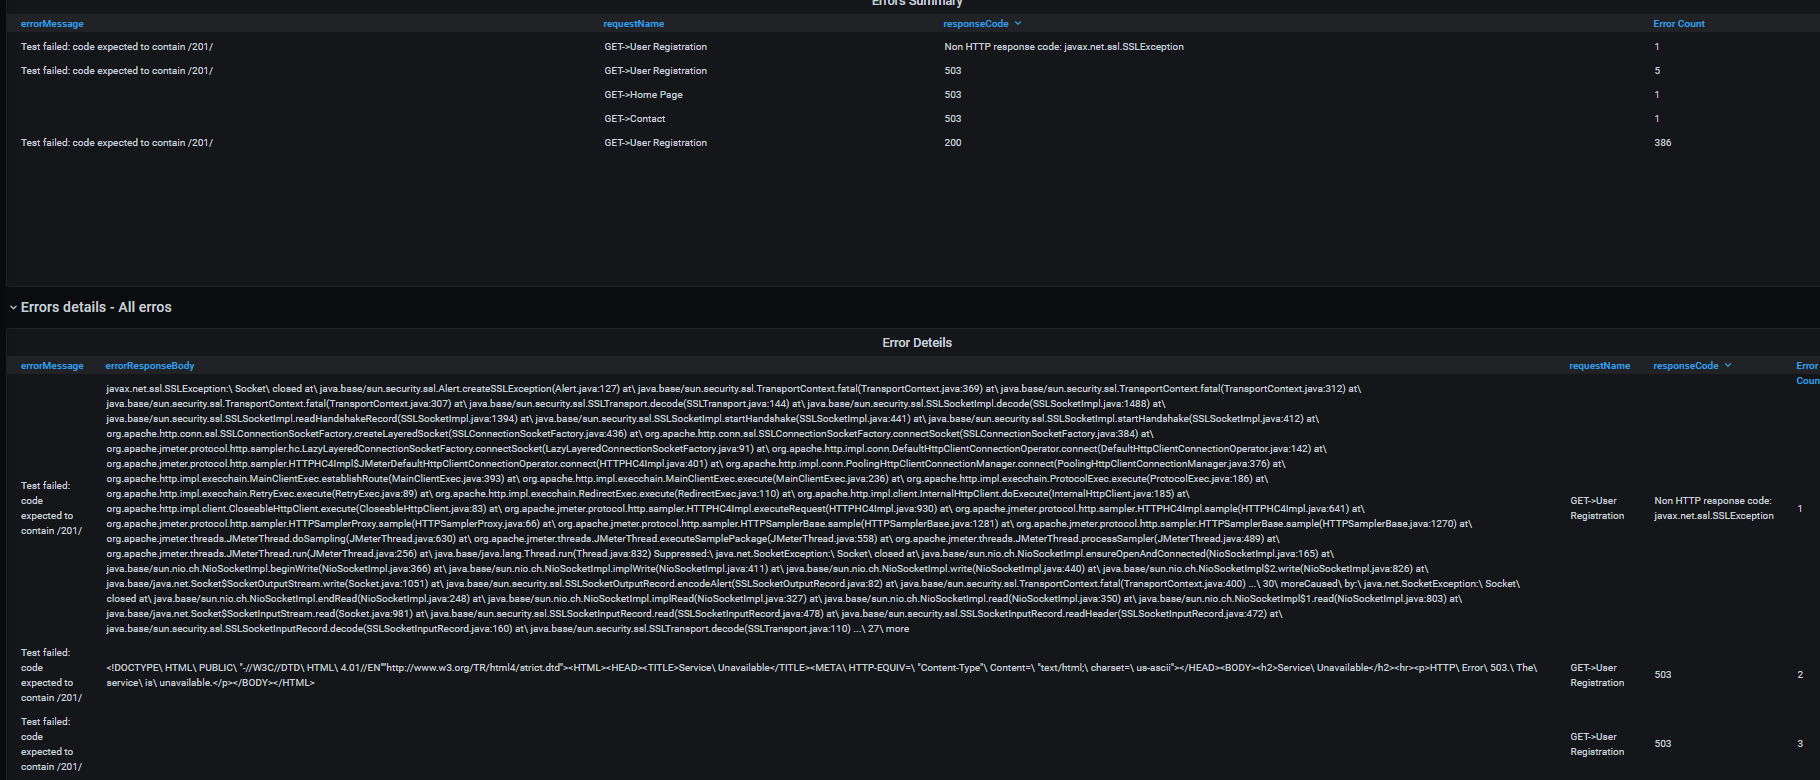
This dashboard requires Apache JMeter 5.3 or higher. It shows overall statistics, generates the transactions charts, aggregate report, latency, and errors overview.
Setup:
- Download the plugin (the latest release). The plugin "
jmeter-plugin-influxdb2-listener-<>.jar" should be located here "~\apache-jmeter-5.x\lib\ext". - Make sure that you have Java 11 - otherwise the plugin will be not displayed on UI.
- Add Backend Listener to your test plan (Add -> Listener -> Backend Listener) and select "
org.md.jmeter.influxdb.visualizer.JMeterInfluxDBBackendListenerClient". - Provide in the Parameters table the InfluxDB settings, provide a name for the test, and specify which samplers to record. For more details, see instruction.
- Configure the dashboard in Grafana, execute tests, and see test results.
Please feel free to reach out to me in case of any questions m.v.derevyanko@gmail.com or Linkedin
Best Regads, Michael Derevyanko
Data source config
Collector type:
Collector plugins:
Collector config:
Revisions
Upload an updated version of an exported dashboard.json file from Grafana
| Revision | Description | Created | |
|---|---|---|---|
| Download |