screenshot.jpg
Products
The Grafana Stack
Pricing
Learn
Stay Up To Date
Technical Learning
Join The Community
Company
Help build the future of open source observability software Open positions
Check out the open source projects we support Downloads
Products
Open source Grafana Prometheus Grafana Loki Grafana Mimir Grafana OnCall Grafana Tempo Graphite Grafana k6 OpenTelemetry
Learn
Company Our team Careers Partnerships Newsroom Contact us
Open source Grafana Prometheus Grafana Loki Grafana Mimir Grafana OnCall Grafana Tempo Graphite Grafana k6 OpenTelemetry
Learn
Company Our team Careers Partnerships Newsroom Contact us
Get Started
Free Forever plan:
- 10,000 series metrics
- 14-day retention
- 50 GB of logs
- 50 GB of traces
- 3 team members
- Grafana, of course
- All dashboards
- FRITZ!Box Status
FRITZ!Box Status
by thielalexander87
Dashboard
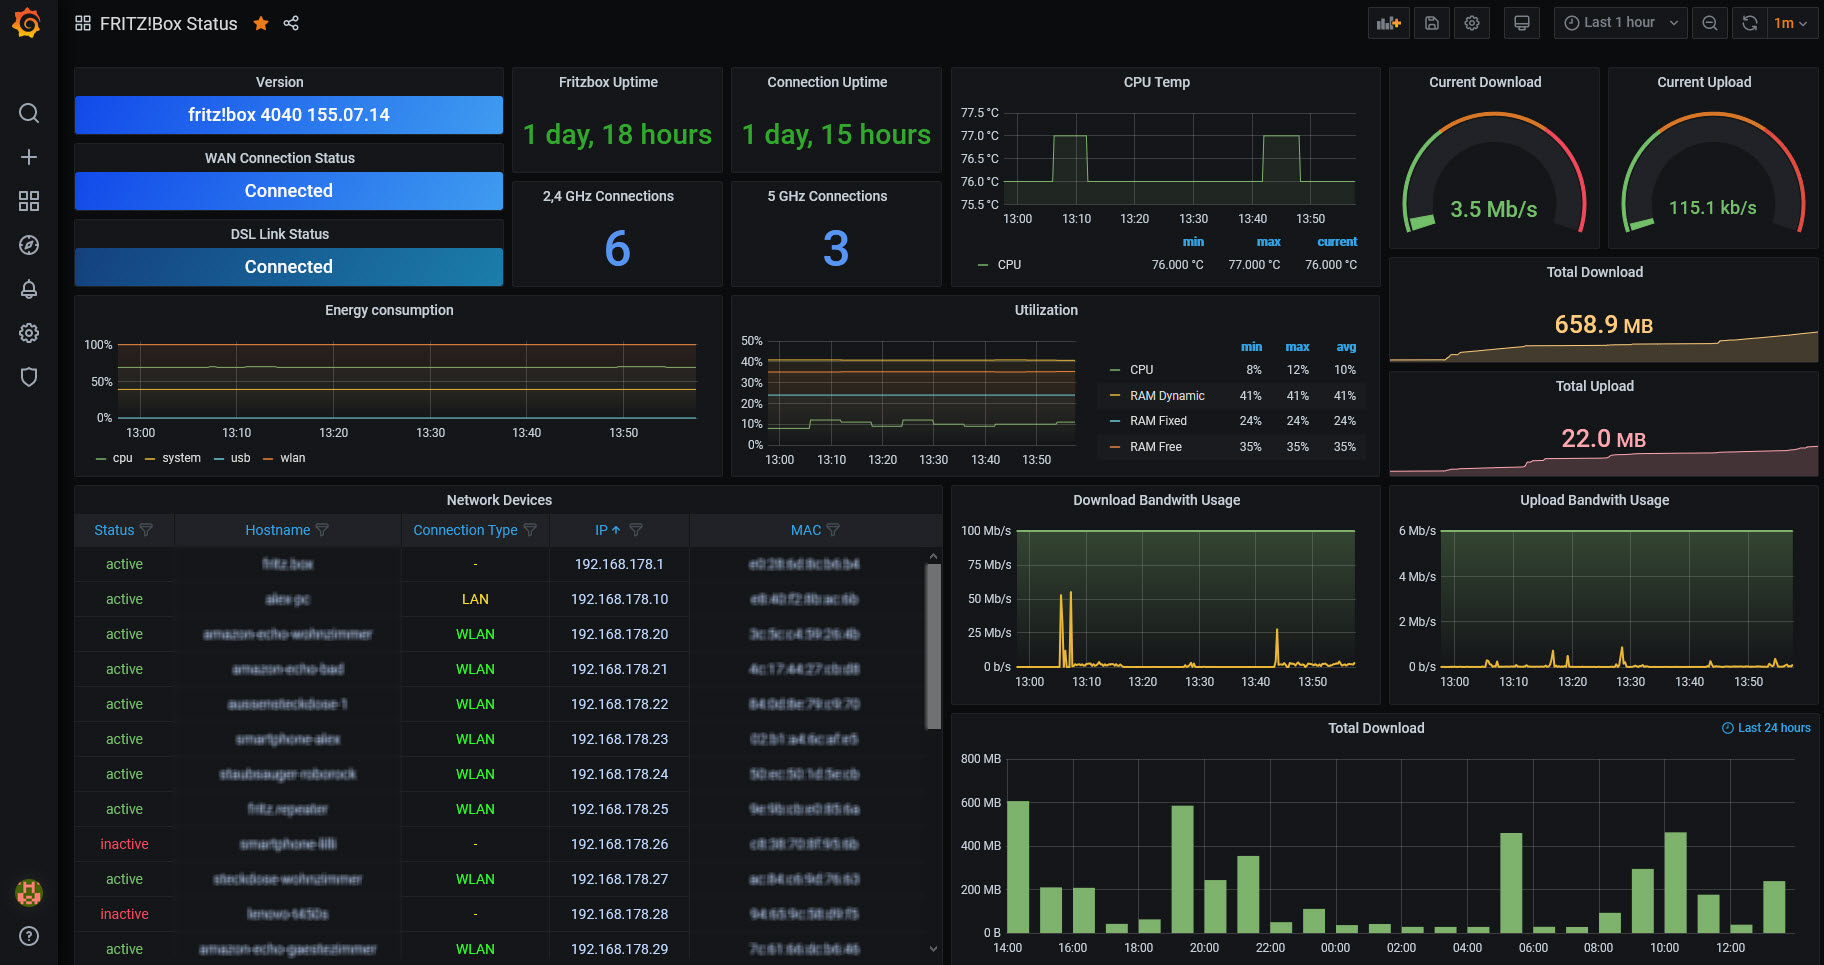
Monitor FRITZ!Box routers using prometheus and fritzbox_exporter
https://github.com/aexel90/fritzbox_exporter
Last updated: a year ago
Copyright 2022 © Grafana Labs