
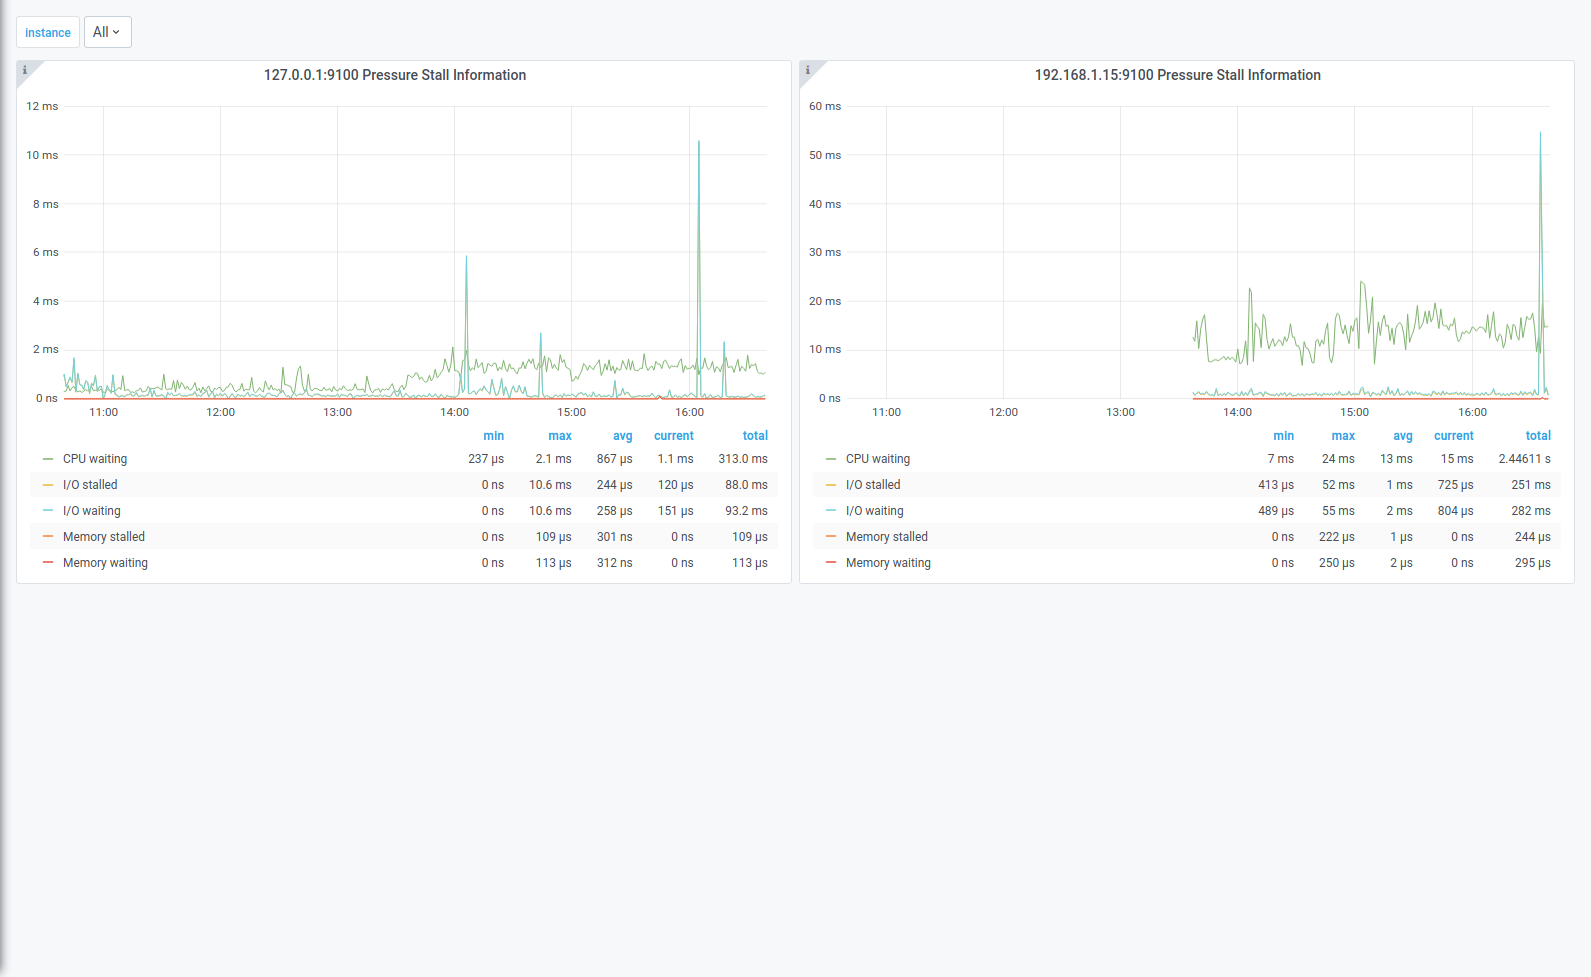
Pressure Stall Information
Simple dashboard for displaying Pressure Stall Information for all the instances in a single dashboard.
Make sure --collector.pressure is enabled.
Make sure the Prometheus data source in grafana has Scrape interval set to the double of greatest scrape interval! This will no longer be necessary once https://github.com/grafana/grafana/issues/21417 is released.
Data source config
Collector type:
Collector plugins:
Collector config:
Revisions
Upload an updated version of an exported dashboard.json file from Grafana
| Revision | Description | Created | |
|---|---|---|---|
| Download |