
Zabbix-Redis
Redis dashboard ready for works with Zabbix Agent version 2
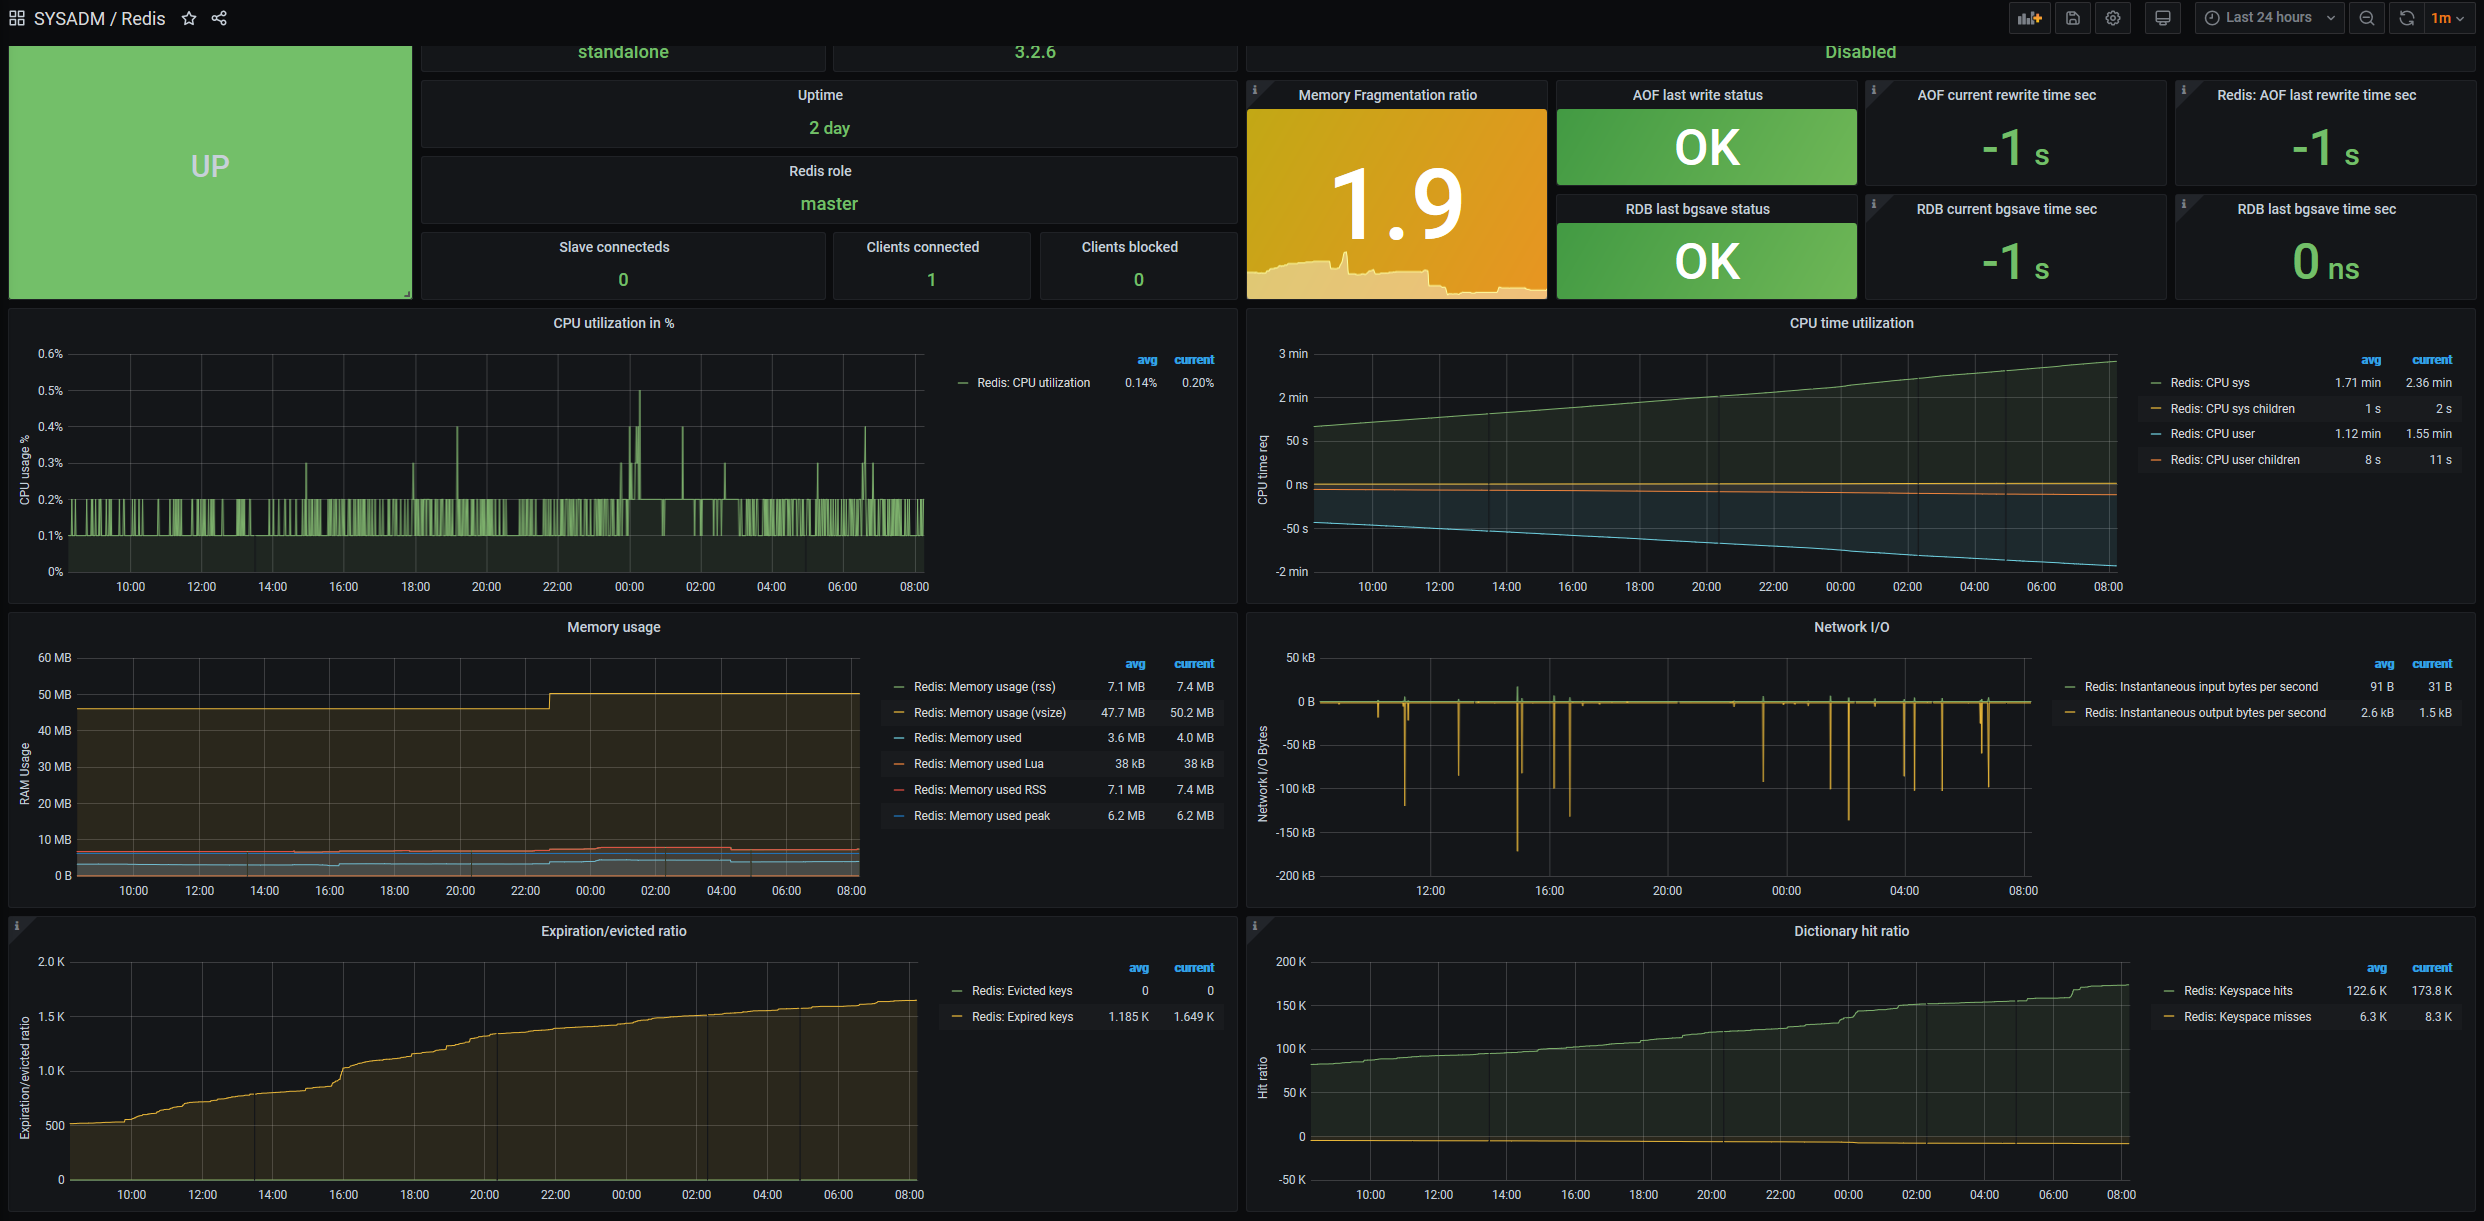
Features
- Status of the service.
- Software versions and modes.
- AOF Metrics.
- RDB Metrics.
- CPU Utilization.
- RAM Utilization.
- Network I/O.
- Expiration/eviction keys metrics.
- Dictionary hit ratio.
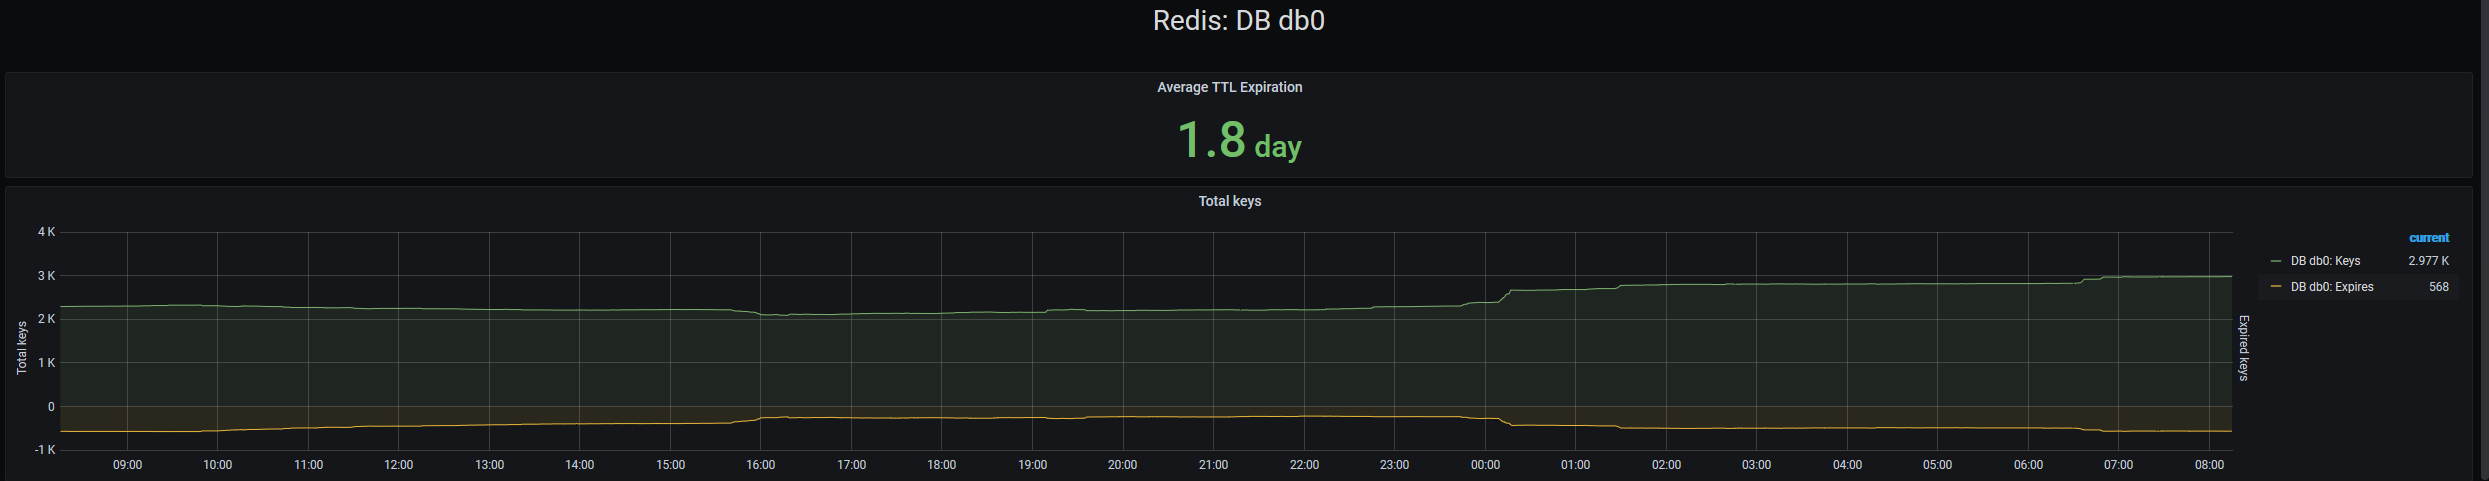
- Autodiscovery for databases with TTL average,Total keys and expired keys.
Requeriments
- Zabbix Agent V2
- Datasource: Zabbix
- Your host must have a host group with the regex name Redis
- Zabbix Template: https://www.zabbix.com/integrations/redis
Support

Data source config
Collector type:
Collector plugins:
Collector config:
Revisions
Upload an updated version of an exported dashboard.json file from Grafana
| Revision | Description | Created | |
|---|---|---|---|
| Download |
Redis
Monitor Redis with Grafana. Easily monitor your Redis deployment with Grafana Cloud's out-of-the-box monitoring solution.
Learn more