
Zabbix-Linux-Infrastructure
Linux dashboard ready for works with Zabbix
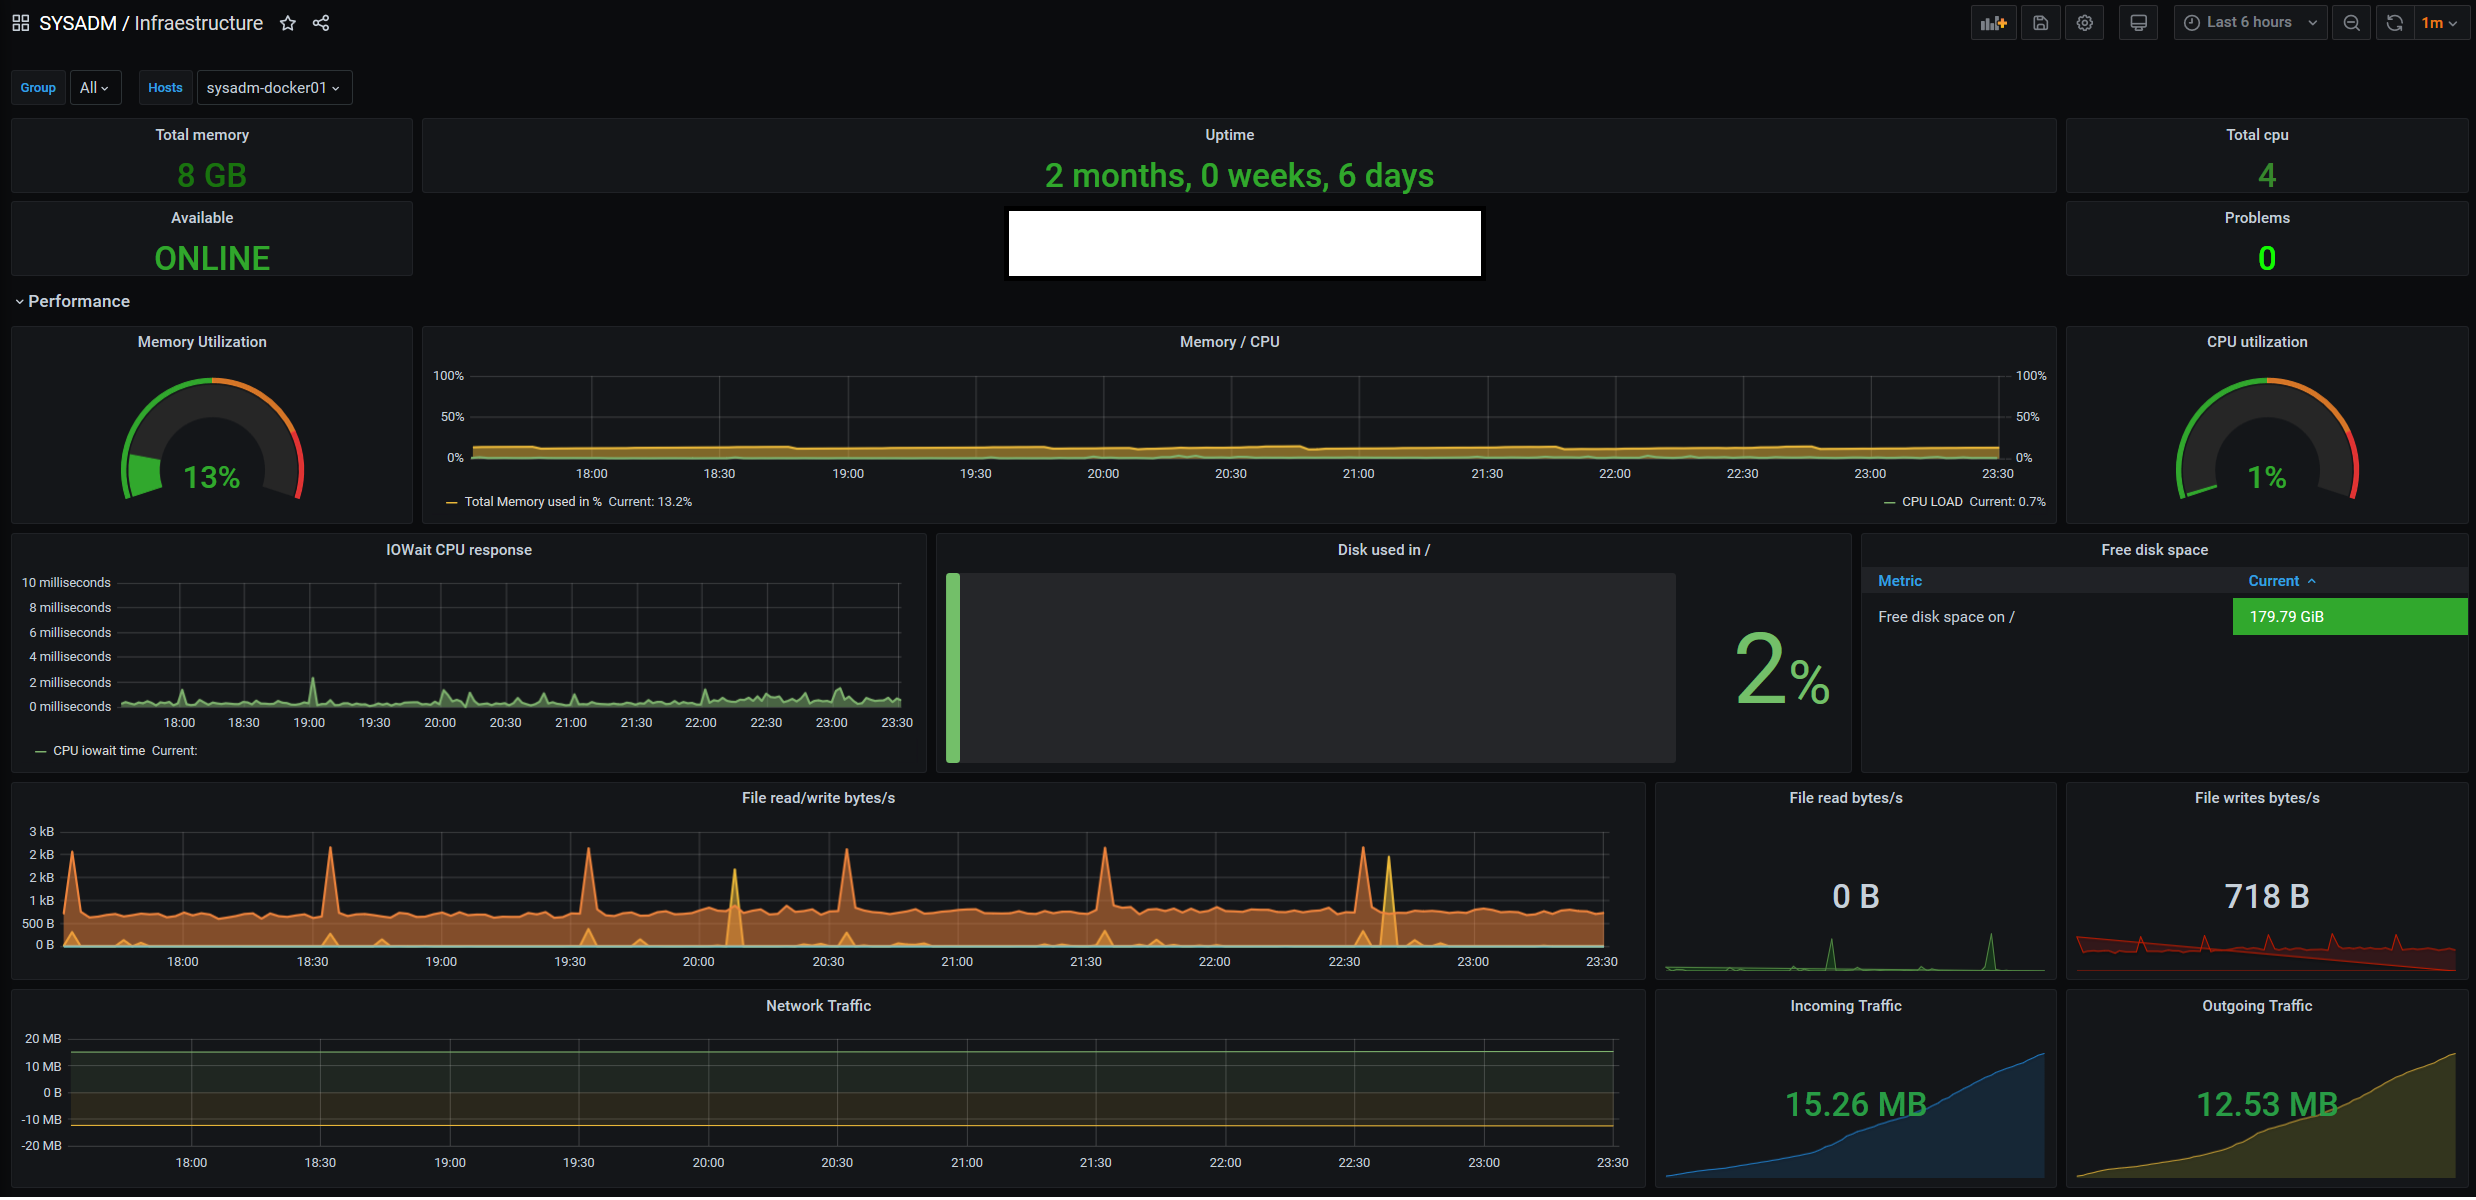
Features
- Total Memory Available
- Ping Status, problem hosts number, CPUs availables
- FQDN
- Memory utilization in % (real) CPU usage in %
- IOWait CPU
- Disk used in /
- Free disk in / with colored bar alert
- File RW/R
- Network I/O
Requeriments
- Datasource: Zabbix
- Some items of Zabbix are custom ( Like calculation item for memory usage)
- Zabbix template: https://github.com/VGzsysadm/Zabbix-templates/blob/master/Zabbix-Linux-Infrastructure.xml
Support

Data source config
Collector type:
Collector plugins:
Collector config:
Revisions
Upload an updated version of an exported dashboard.json file from Grafana
| Revision | Description | Created | |
|---|---|---|---|
| Download |
Linux Server
Monitor Linux with Grafana. Easily monitor your Linux deployment with Grafana Cloud's out-of-the-box monitoring solution.
Learn more